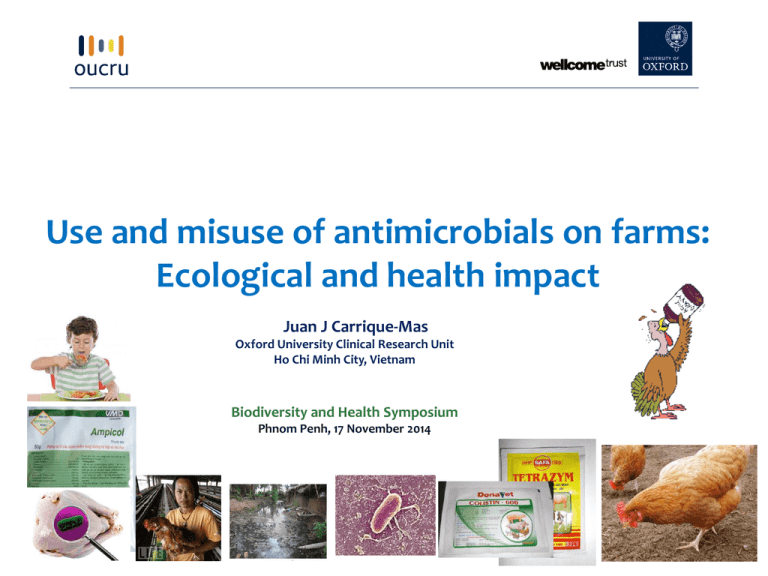
Use and misuse of antimicrobials on farms:
Ecological and health impact
Juan J Carrique-Mas
Oxford University Clinical Research Unit
Ho Chi Minh City, Vietnam
Biodiversity and Health Symposium
Phnom Penh, 17 November 2014
Agenda
• AMR: A complex ‘ecohealth’ problem
• Economic development and animal production
• The ‘ecological web’ of AMR
• Other AMR co-selecting environmental pollutants
• Data from current projects (OUCRU-VN):
- Antimicrobial consumption
- Transmission of AMR between humans and animals
• The way forward
– Future projects
The ‘Confusogram’
?????
J. F. Prescott et al. (2000) Antimicrobial Therapy in Veterinary Medicine
The VAC system in Vietnam
Source: FAO (2004)
Fish andand
shrimp
production
in Vietnam
(2004
to
2011)
Human
farm
density
in
SE
Asia*
Animal protein consumption: Vietnam
Humans
* Sources: LEAD and FAO (2000, 2006)
Pig farms
Chicken farms
Antimicrobial use in animal production
S. Page and P. Gautier (2012), Rev. sci. tech. Off. int. Epiz., 2012, 31 (1), 145-188
Post antimicrobial effects
Fate of antimicrobials
Distribution at sub-inhibitory concentrations
Fate of antimicrobials
Fate of antimicrobial
Fateresistant
of antimicrobial
bacteria
resistant bacteria
Fate of resistant genes
Fate of resistant genes
Interaction with
• Pathogens and commensals
environmental
• Direct transfer from host
to host
• Indirect transfer (food, water, environmental
pathways)
bacteria?
• Vertical transfer
• Horizontal transfer between unrelated bacteria
*Adapted from Da Costa et al. (2013) Int. J. Environ. Res. Public Health 2013, 10: 278-294
7
AMR and environmental bacteria
- Environmental bacteria >95% of the earth’s
microbiome
- Naturally produce antimicrobials as signalling
molecules at low concentrations
- Naturally multi-drug resistant
- Most plasmid-mediated ARG originate from the
environment
i.e. qnr from waterborne bacteria
- Since 1950’s humans have manufactured
antimicrobials and used them at industrial levels,
this results in unprecedented levels of exposure
of the earth’s microbiome to antimicrobials
Ecological concerns
• Commensal, pathogenic flora, and ARG interact with environmental organisms in
certain hotspots
•ARG integrated in gene-transfer elements (plasmids,
transposons, integrons) the highest risk
Farm,
hospital
• ARG can be maintained in the absence of
antimicrobial selective pressure and co-selected due to
other stressors (siderophores, toxins, heavy metals,
biocides)
Do changes in the natural ecosystems as a consequence of
human activities accelerate evolution towards AMR?
• ARG detected in bacteria from environmentally
pristine locations, indicating dissemination
• qnr encoded in plasmids detected in Aeromonas spp.
† J.
Martinez (2009). Proc. R. Soc. B.
Confirmed hospital-acquired Acinetobacter baumannii infections,
respiratory patients, ICU (HTD, HCMC (Vietnam) (2000-2014)
Year
2000
2001
2002
2003
2004
2005
2006
2007
2008
2009
2010
2011
2012
2013
Total No.
isolates
12
33
37
42
55
24
25
24
5
20
56
53
97
136
619
Amikacin
No. R/No.
Tested
2/9
15/23
17/37
18/42
26/55
9/24
10/24
9/24
3/5
17/18
45/54
38/49
80/96
106/134
395/594
Imipenem
%
22.2%
65.2%
45.9%
42.9%
47.3%
37.5%
41.7%
37.5%
60.0%
94.4%
83.3%
77.6%
83.3%
79.1%
66.5%
Source: James I. Campbell, OUCRU-HCMC
No. R/No.
Tested
NT
NT
4/37
9/42
14/55
3/24
1/24
2/23
1/5
19/20
41/56
41/51
81/96
120/135
336/602
Colistin
%
10.8%
21.4%
25.5%
12.5%
4.2%
8.7%
20.0%
95.0%
73.2%
80.4%
84.4%
88.9%
55.8%
No. R/No.
Tested
NT
NT
NT
NT
NT
NT
NT
NT
0/18
2/55
0/48
2/94
4/134
0/1
8/350
%
NT
NT
NT
NT
NT
NT
NT
NT
0.0%
3.6%
0.0%
2.1%
3.0%
0.0%
2.3%
AMR in E. coli in humans and chickens
in the Mekong Delta
Tien Giang
VIBRE Project
Rural areas (3 districts)
Chicken farm
•Knowledge and use of antimicrobials:
•Bio-security
Chicken farms
(N=204)
Development of AMR E. coli ?
Urban areas (1 city)
•Use of antimicrobials
•Food habits
Non-farmers (N=204)
•Not involved in poultry
farming
•Matched by commune,
age/sex to farmer
Transfer of AMR?
•Use of antimicrobials
•Contact with chickens
•Food habits
Chicken farmers
(N=204)
Transfer of AMR?
•Use of antimicrobials
•Food habits
Urban
inhabitants
(N=102)
•Not involved in poultry
farming
•Living in urban centre of
My Tho
Antimicrobial agents used in chicken farming, TG
Class of
antimicrobial
Name of antimicrobial
No. (%)
formulations
containing the
product
(N=157)
57 (36.3%)
No. (%) farms
using (N=208)
Tetracyclines
Doxycycline, oxytetracycline, tetracycline
53 (25.5%)
Polypeptides
Colistin
48 (30.6%)
41 (19.7%)
Macrolides
Tylosin, tilmicosin, erythromycin, spiramycin
40 (25.5%)
40 (19.2%)
Penicillins
Ampicillin, amoxicillin
41 (26.1%)
34 (16.3%)
Quinolones
Flumequine, oxolinic acid, norfloxacin, enrofloxacin
22 (14.0%)
19 (9.1%)
Aminoglycosides
19 (12.1%)
19 (9.1%)
Phenicols
Spectinomycin, neomycine, gentamicin, apramycin,
streptomycin
Florfenicol, thiamphenicol
14 (8.9%)
12 (5.8%)
Sulphonamides/
trimethoprim
Sulfamethoxazole, sulphadimidine, sulphadimetoxine,
sulphadimerazine, trimethoprim
12 (7.6%)
12 (5.8%)
Lincosamides
Lincomycin
4 (2.5%)
4 (2.5%)
Pleuromutilin
Tiamulin
1 (0.6%)
1 (0.5%)
13
Penicillins
Polipeptides
Macrolides
Tetracyclines
Quinolones
Phenicols
Aminoglycosides
Sulphonamides
Lincosamides
6
33
2
1
2
5
3
25
1
13
6
20
No.
administrations
Pleuromutilins
Lincosamides
Sulphonamides
Aminoglycosides
Phenicols
Quinolones
Tetracyclines
Macrolides
Polypeptide
Penicillin
Antimicrobial formulations, TG
1
41
1
3
48
5
4
1
40
7
57
1
22
8
14
1
1
3
3
19
12
1
Pleuromutilin
100/157 (64% products were ‘mixes’ of 2 or more antimicrobials)
4
1
tylosin tartrate,
trimethoprim,
sulphadiazine,
sulphamethoxazole
AMU on chicken farms, Tien Giang
Variable
Number of antimicrobial products used over
study period
Method of administration
Type of administration
Timing
Advice given by
Level
0
1
>1
Water
Feed
Feed and water
Prophylaxis
Treatment
Both
On arrival
Continuously
Periodic
Other
Drug seller
District veterinarian
Friend/neighbour
Sales person
Other
All farms (N=208)
40.9%
40.9%
18.3%
82%
9%
4%
84%
12%
4%
34%
18%
29%
19%
56%
18%
12%
12%
2%
Antimicrobial consumption in relation to chicken
production
Stratum
No. farms
sampled
No.
chickens
sampled
No.
chickens
(census)
Fraction
sampled
(%)
CG, hh
CG, sm
CT, hh
CT, sm
MT, hh
MT, sm
All
34
34
36
36
34
34
208
2,890
47,970
4,505
50,230
2,290
52,500
160,385
409,850
128,250
268,295
56,700
58,310
73,300
994,705
0.007
0.374
0.017
0.886
0.039
0.716
0.161
Milligrams of
Grams of active
active compound
Sampling
compound per
used per week
weight
1,000 chickens
per chicken
produced
(±SE)
141.8
30.4 (±15.6)
901.2 (±622.8)
2.7
5.3 (±1.5)
167.5 (±63.9)
59.5
5.6 (±1.4)
327.8 (±122.4)
1.1
18.6 (±7.2)
193.1 (±57.3)
25.5
26.4 (±17.2)
413.8 (±256.4)
1.4
4.7 (±1.9)
156.6 (±63.7)
15.1 (±4.0)
358.1 (±113.5)
16
What’s on the menu?
Colistin: 120 mg/Kg
Neomycin: 400 mg/Kg
Florfenicol: 60mg/Kg
Kitasamycin: 300 mg/Kg
In Vietnam, most commercial animal feed
rations are medicated
AMR testing in E. coli
1
ampicillin (10µg)
2
ceftriaxone (30µg)
3
ceftazidime (30µg)
4
chloramphenicol (30µg)
5
ciprofloxacin (1µg)
6
ciprofloxacin (5µg)
7
trimethoprim-sulphamethoxazole (1.25 µg /23.75µg)
8
gentamicin (10µg)
9
amikacin (30µg)
10 meropenem (10µg)
11 amoxicillin-clavulanic acid (20/10µg)
12 tetracycline (30µg)
Disc diffusion test
Antimicrobial resistance in E. coli (non-selective plates)
VIBRE Project
1.00
Chicken (N=893)
0.90
Farmer (N=933)
Rural, non farmer (N=919)
0.80
Urban, non farmer (N=415)
Percent resistance
0.70
0.60
0.50
0.40
0.30
0.20
0.10
0.00
C
TE
SXT
CIP1
CIP5
AK
CN
MEM
AMP
AMC
CRO
CAZ
ESBL
Diversity among chicken and human E. coli
Shannon-Weaver index (H)
N=5 colonies per study subject
Shannon-Weaver diversity index (H)
Human and chicken E. coli AMR patterns (I)
1
2
3
4
5
---C--TE-STX----AMP- AMC---C-------AMP- ----------AMP- ----------AMP- ---C--TE-STX-----
1 -----TE-----2 ---C--TE-----AMP-
X
3 ----------AMP3 ---C--TE-----AMP5 ---C--TE-STX----AMP-
X
Matching: 3/50 (6%)
X
Comparisons of E. coli patterns from humans and chickens
Distances
Chicken vs. farmer a
Chicken vs. rural control b
Chicken vs. urban control c
Farmer vs. Rural control d
Farmer vs. Urban control e
Rural vs. Urban control f
No. calculations
201
199
97
196
95
97
Median [75% IQR]
2.76 [2.07-3.40]
3.12 [2.52-4.04]
3.47 [2.68-4.15]
3.02 [2.40-3.89]
3.20 [2.52-4.22]
3.25 [2.36-4.24]
Antimicrobial resistance in pig
pathogens
AMR among pig pathogens (n=53)
Streptococcus spp. other than S. suis (N=9)
1.0
0.9
0.9
0.8
0.8
Proportion resistant
Proportion resistant
Staphylococcus spp. (N=10)
1.0
0.7
0.6
0.5
0.4
0.3
0.2
0.1
0.7
0.6
0.5
0.4
0.3
0.2
0.1
0.0
AMP
OX
VA
CRO
CAZ
CN
C
CIP
SXT
0.0
TE
AMP
VA
CRO
CAZ
CN
C
CIP
SXT
TE
Gram negative coccobacilli (N=5)
1.0
0.9
0.9
0.8
0.8
Proportion resistant
1.0
0.7
0.6
0.5
0.4
0.3
0.2
0.1
0.7
0.6
0.5
0.4
0.3
0.2
0.1
0.0
AMP
OX
VA
CRO
CAZ
CN
C
CIP
SXT
TE
0.0
AMP
CRO
CAZ
CN
E
C
CIP
TE
Enterobacteriacea (N=15)
1.0
0.9
Proportion resistant
Proportion resistant
Streptococcus suis (N=22)
OX
0.8
0.7
Source: Severe disease in piglets in southern Vietnam: main
bacterial aetiologies and antimicrobial resistance. J. Campbell et
al, 2014 (in preparation)
0.6
0.5
0.4
0.3
0.2
0.1
0.0
AMP
CRO
CAZ
CN
C
CIP
SXT
TE
24
Longitudinal studies on AMR in pig and chicken farms
E. coli
Enterococcus spp.
Environmental stressors and AMR:
Quaternary ammonium compounds (QAC)
Use of QAC in chicken farms
Product
Disinfectant class
Percent farms
using (%)
(N=208)
1
QAC
68.2
2
Peroxygen-based
3.4
3
Halogen-Releasing agent 1
3.4
4
Halogen-Releasing agent 2
1.9
5
Other
23.0
Adaptation experiments to QAC
Determine MIC for each isolate
Expose 105 cfu/ml of bacteria to 0.5MIC (37oC, 18-20h)
Stabilise bacteria in MHB without disinfectant (37oC, 5h)
Calibrate suspension to 105cfu/ml and transfer to new MHB supplemented with 0.75 MIC
QAC disinfectant
Stabilise bacteria in MHB without disinfectant for 5h at 37oC
Expose bacteria to step-wise increase concentration of disinfectant
Until no growth observed, the highest concentration of disinfectant that bacteria
can survive were used
Cross-resistance QAC and antimicrobials
Study ID
AD01-c
AD01-p
AD01-ef
AD02-c
AD02-p
AD02-ef
AD03-c
AD03-p
AD03-ef
AD04-c
AD04-p
AD04-ef
AD09-c
AD09-p
AD09-ef
AD10-c
AD10-p
AD10-ef
TE
S
S
S
S
R
S
S
R
R
S
R
R
S
I
I
S
I
I
CN
S
S
I
S
S
S
S
S
I
S
S
I
S
S
I
S
S
S
AMP
S
R
R
S
R
R
S
R
R
S
R
R
S
R
R
S
R
R
CIP
S
S
S
S
S
S
S
I
S
S
S
S
S
S
S
S
I
S
CT
I
I
I
I
R
I
I
R
R
I
R
R
I
I
R
I
R
R
SXT
S
S
S
S
S
S
S
S
S
S
S
S
S
S
I
S
S
S
c = control; p = post adaptation; ef= after treating with PAβN
C
S
I
S
S
S
S
S
I
S
I
I
I
S
S
I
S
R
I
The link between AMU and AMR is
uncontroversial
Chantziaras et al (2014) Journal of
Antimicrobial Chemotherapy, 69:
827-834.
30
A vociferous skeptical minority
WoK quoted >350 times!!!
Priorities for research….and for policy
1. Carry out farming with less antimicrobials
2. If antimicrobials are used, limit their impact on
animals and their environment
• Understand why and where antimicrobials are used in
agriculture
– Increase awareness
– Change attitudes and behaviours
• Surveillance of AMU and AMR:
– Monitoring of antimicrobial use and ARG
• Understand impact of antimicrobial use on the
environmental (AM, ARG, bacteria)
• Intervention studies to reduce AMU
• Technical solutions to limit impact.. and test them!
Acknowledgements
• Zoonoses Group
• ITU, CTU, Microbiology, Enterics Group
• Mr. Trung Nguyen Vinh
• Dr. Ngo T. Hoa
• Mr. James Campbell
• Dr. Constance Schultsz
• Sub-Department of Animal Health Tien Giang, Dong Thap
• Hospital Tropical Diseases HCMC
Funding:
• ZoNMW / WOTRO (The Netherlands) (VIBRE Project)
• The Wellcome Trust
Thanks for your attention!
jcarrique-mas@oucru.org

