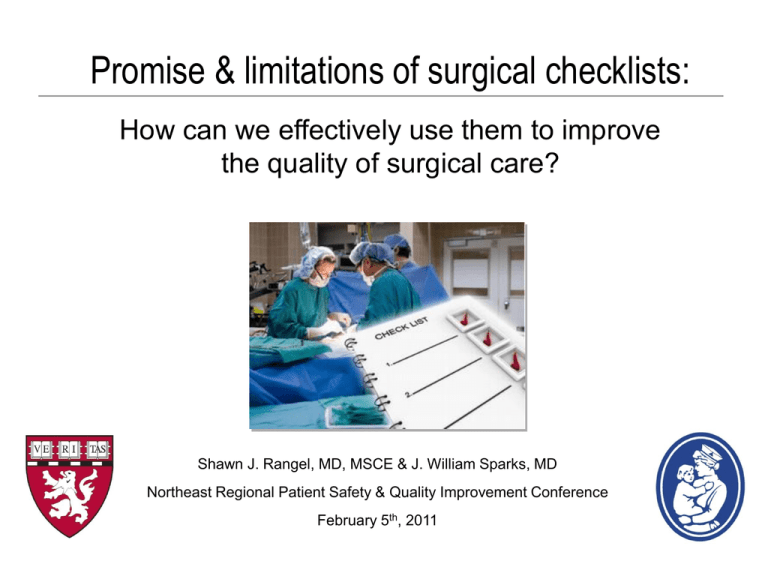
Promise & limitations of surgical checklists:
How can we effectively use them to improve
the quality of surgical care?
Shawn J. Rangel, MD, MSCE & J. William Sparks, MD
Northeast Regional Patient Safety & Quality Improvement Conference
February 5th, 2011
WHO checklist
Reality check- IHI map
Even the stars are using it!
So, will the WHO checklist save mankind?
Reality check: one size does not fit all…
Outline of today’s discussion
• Review evidence supporting surgical safety checklists
• Attitudes toward the safety checklist at (CHB survey)
• Strategies for improving checklist utilization & relevance
• Next steps: IT, custom checklists & beyond…
WHO study
8 Evaluation Sites
PAHO I
Toronto, Canada
EURO
EMRO
London, UK
Amman, Jordan
WPRO I
Manila, Philippines
PAHO II
Seattle, USA
WPRO II
AFRO
Ifakara, Tanzania
SEARO
New Delhi, India
Auckland, NZ
Methods
• 1 to 4 operating rooms targeted at each site
• 18-item checklist implemented (sign-in, time-out, sign-off)
• Pre-post intervention study design (general surgery cases)
• Primary outcome measure: aggregate 30-day major
complication rate (NSQIP* defined)
*National Surgical Quality Improvement Project
Results: impact on morbidity & mortality
(3 month comparison periods)
Baseline
Checklist
P value
Cases
3,733
3,955
-
Death
1.5%
0.8%
0.003
Any complication
11.0%
7.0%
<0.001
Surgical site infection
6.2%
3.4%
<0.001
Unplanned Reoperation
2.4%
1.8%
0.047
Limitations of the study
• Unknown influence of the Hawthorne effect
• Unable to prove causality (non-randomized design)
• Effect size may be exaggerated (developing nations)
• Only one of the eight centers was in the U.S.
• Pediatric patients not included in analysis
SURPASS
Intervention
The comprehensive “SURgical PAtient Safety System”:
Methods
•SURPASS implemented at 6 tertiary-care hospitals
•Pre-post intervention study design (3 month periods)
•12 adverse event categories audited
•Outcomes compared with five “control” hospitals
Results: impact on morbidity & mortality
(3 month comparison periods)
Baseline
Checklist
(n=3,760)
(n=3,820)
Mortality
1.5%
0.8%
-
Any complication
15.4%
10.6%
<0.001
Complications/100 cases
27.3%
16.7%
<0.001
P value
Use of the checklist was associated with a significant reduction in
complication rates for 10 of the 12 (82%) event categories in the study
But, kids are not small adults!
Pediatric Safe Surgery Collaborative
•
Children’s Hospital Boston
Shawn J. Rangel (Study PI)
Beth K. Norton (Co-study PI)
Jessica Baxter
•
Texas children’s Hospital
Thomas Luerssen (site PI)
Carrie Smith-Bruce
•
Riley Children’s Hospital
Fred Rescorla (Co-site PI)
Charles Leys (Co-site PI)
Margo Regas
•
Denver Children’s Hospital
Tammy Woolley (Site PI)
Jenae Nieman
•
Children’s Healthcare Atlanta
Kurt Heiss (Site PI)
Kawana Mitchell
•
Children’s National Med Center
Kurt Newman (Co-site PI)
Rahul Shah (Co-site PI)
Andrea Ewing-Thomas
•
Children’s Hospital of Philadelphia
Peter Mattei (Site PI)
Lisa Czyzewski
Collaborative process
• Identification & recruitment of checklist champions
• Development of site-specific checklist
• Plan for piloting on small scale
• Obtaining buy-in from hospital leadership & peers
• Full implementation OR-wide
• Develop internal plan for auditing compliance
General study design
• Seven hospitals included as “checklist” implementers
• All inpatient procedures from 7 surgical services included
Cardiac, General, Neuro, Ortho, Plastics, Oto & Urology
• Pre-post intervention comparison design (9 months)
• Primary endpoint: Aggregate 30-day adverse event rate
• PHIS database used to identify events
• Results compared against seven control hospitals
Patient characteristics (demographics)
Checklist hospitals (n=7)
Control Hospitals (n=7)
Pre-intervention Post-intervention Pre-intervention Post-intervention
(n=19,867)
(n=18,850)
(n=15,616)
(n=15,298)
Age (mean years)
6.9
7.1
7.2
7.4
Sex (% male)
55.3
54.2
56.5
56.6
Insurance status :
Government (%)
Private (%)
Other (%)
62.5
24.8
12.7
63.2
24.6
12.2
50.2
39
10.8
53.9
39.7
7.3
Race/ethnicity:
African American(%)
Hispanic (%)
20.2
16.9
18.5
17.5
10.6
23.3
10.8
26
Case Mix Index
6.1
6.1
5.5
5.5
Acuity of procedure
(% emergent)
15.6
18.9
18.8
19.6
Rate of any adverse event
P=0.364
Incidence (%)
P=0.064
MORTALITY
RR of death with checklist utilization: 0.73 (95%CI: 0.57-0.93)
p=0.018
Incidence (%)
p=0.758
MORTALITY (High-risk specialties)
p=0.332
Incidence (%)
p=0.064
p=0.080
MORTALITY (emergent procedures)
RR of death with checklist utilization: 0.58 (95%CI: 0.36-0.95)
p=0.029
Incidence (%)
p=0.724
MORTALITY (ICU admissions)
RR of death with checklist utilization: 0.57 (95%CI: 0.40-0.82)
Incidence (%)
p=0.002
p=0.731
Limitations of the study
• Unknown influence of the Hawthorne effect
• Unable to prove causality (non-randomized design)
• Reliance on administrative data for outcomes analysis
• Variation/degree of checklist compliance unknown
What can be concluded from the
available data?
USE OF A
SURGICAL SAFETY CHECKLIST
CAN SAVE LIVES !!!!!!
So then, how do people feel about using a
surgical safety checklist?
--CHB Checklist Survey-• Multidisciplinary targeting (3-headed monster!)
• Assess attitudes towards the checklist
• Gain insight on CHB’s current safety culture
• Obtain feedback for improving checklist utility
Checklist survey:
Responses by specialty (n=177)
Has the checklist improved safety?
(response = yes)
Proportion of responders (%)
Chi2, p=0.948
Proportion of responders (%)
How has the checklist improved safety?
Have you witnessed an error or
complication prevented by the checklist?
Proportion of responders (%)
(response=yes)
Chi2, p=0.048
Has the checklist improved efficiency?
Proportion of responders (%)
(response=yes)
Chi2, p=0.110
Would I want the checklist used for my child?
(response=yes)
Proportion of responders (%)
Chi2, p=0.122
Proportion of responders (%)
Content adequacy of current checklist?
Chi2, p=0.987
Chi2, p=0.987
Chi2, p=0.987
So, is everyone in love with the checklist??
“This checklist is bullsh&! and just reinforces the
Betty Crocker approach to medicine !!”
“This is probably the most important surgical safety
intervention we could ever implement !!”
Root causes of “checklist fatigue”
“This is stupid- the checklist
does not apply to my cases”
• Blood products available?
• Imaging reviewed?
• Special equipment available?
• DVT prophylaxis considered?
• IV access adequate?
“This is stupid- we do this
all the time anyway”
So then, how can we improve the
effectiveness of our checklist?
• Implementation of forcing cues into work flow
• Incorporation of a more effective auditing system
• Transition to a “quality”-centered checklist paradigm
• Development of customized checklists
Change in the checklist paradigm:
transitioning from “safety” to “quality”
Safe
Value-based
Surgical
Quality
Efficient
Effective
Variation in the use of surgical antibiotic
prophylaxis for common pediatric procedures
How can we accomplish these goals?
How can we accomplish these goals?
Take home lessons….
• EFFECTIVE use of surgical checklists CAN SAVE LIVES!
• Checklist MUST be team-based and emphasize communication!
• Checklists HAVE to be developed with input from ALL stakeholders
• Leadership ABSOLUTELY has to be on board!
And finally….
YOU ARE THE FUTURE OF
SAFETY CULTURE!!!


