1 Croatian Institute for Brain Research, University of Zagreb
advertisement

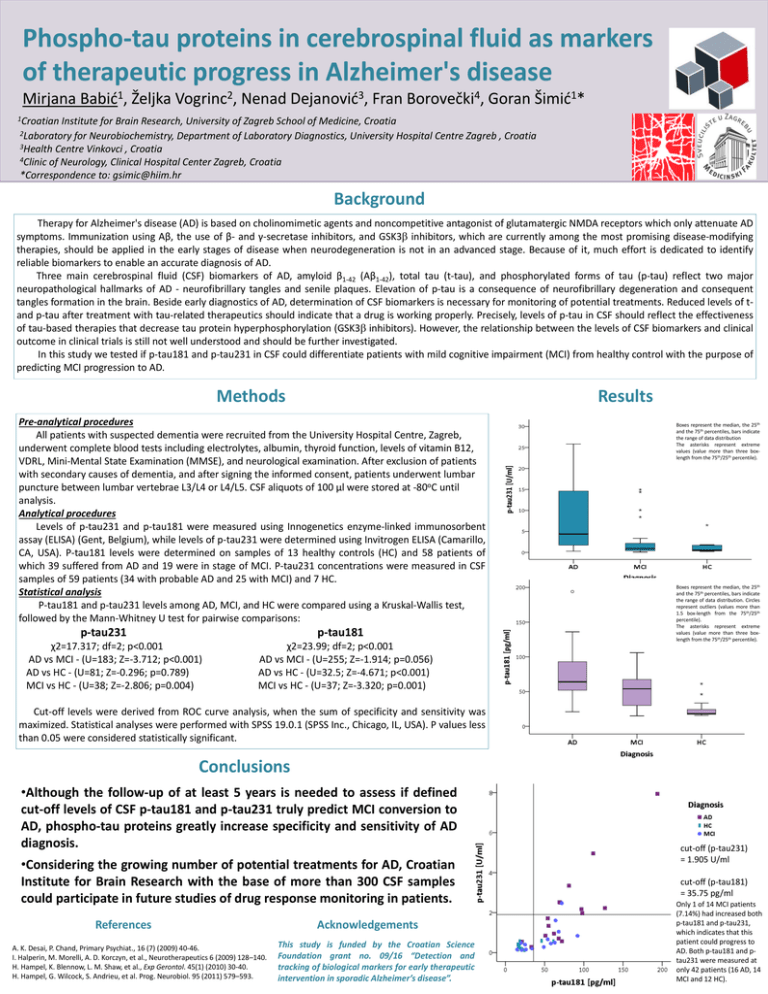
Phospho-tau proteins in cerebrospinal fluid as markers of therapeutic progress in Alzheimer's disease Mirjana Babić1, Željka Vogrinc2, Nenad Dejanović3, Fran Borovečki4, Goran Šimić1* 1Croatian Institute for Brain Research, University of Zagreb School of Medicine, Croatia 2Laboratory for Neurobiochemistry, Department of Laboratory Diagnostics, University Hospital Centre Zagreb , Croatia 3Health Centre Vinkovci , Croatia 4Clinic of Neurology, Clinical Hospital Center Zagreb, Croatia *Correspondence to: gsimic@hiim.hr Background Therapy for Alzheimer's disease (AD) is based on cholinomimetic agents and noncompetitive antagonist of glutamatergic NMDA receptors which only attenuate AD symptoms. Immunization using Aβ, the use of β- and γ-secretase inhibitors, and GSK3 inhibitors, which are currently among the most promising disease-modifying therapies, should be applied in the early stages of disease when neurodegeneration is not in an advanced stage. Because of it, much effort is dedicated to identify reliable biomarkers to enable an accurate diagnosis of AD. Three main cerebrospinal fluid (CSF) biomarkers of AD, amyloid β1-42 (Aβ1-42), total tau (t-tau), and phosphorylated forms of tau (p-tau) reflect two major neuropathological hallmarks of AD - neurofibrillary tangles and senile plaques. Elevation of p-tau is a consequence of neurofibrillary degeneration and consequent tangles formation in the brain. Beside early diagnostics of AD, determination of CSF biomarkers is necessary for monitoring of potential treatments. Reduced levels of tand p-tau after treatment with tau-related therapeutics should indicate that a drug is working properly. Precisely, levels of p-tau in CSF should reflect the effectiveness of tau-based therapies that decrease tau protein hyperphosphorylation (GSK3 inhibitors). However, the relationship between the levels of CSF biomarkers and clinical outcome in clinical trials is still not well understood and should be further investigated. In this study we tested if p-tau181 and p-tau231 in CSF could differentiate patients with mild cognitive impairment (MCI) from healthy control with the purpose of predicting MCI progression to AD. Methods Results Pre-analytical procedures All patients with suspected dementia were recruited from the University Hospital Centre, Zagreb, underwent complete blood tests including electrolytes, albumin, thyroid function, levels of vitamin B12, VDRL, Mini-Mental State Examination (MMSE), and neurological examination. After exclusion of patients with secondary causes of dementia, and after signing the informed consent, patients underwent lumbar puncture between lumbar vertebrae L3/L4 or L4/L5. CSF aliquots of 100 µl were stored at -80oC until analysis. Analytical procedures Levels of p-tau231 and p-tau181 were measured using Innogenetics enzyme-linked immunosorbent assay (ELISA) (Gent, Belgium), while levels of p-tau231 were determined using Invitrogen ELISA (Camarillo, CA, USA). P-tau181 levels were determined on samples of 13 healthy controls (HC) and 58 patients of which 39 suffered from AD and 19 were in stage of MCI. P-tau231 concentrations were measured in CSF samples of 59 patients (34 with probable AD and 25 with MCI) and 7 HC. Statistical analysis P-tau181 and p-tau231 levels among AD, MCI, and HC were compared using a Kruskal-Wallis test, followed by the Mann-Whitney U test for pairwise comparisons: p-tau231 p-tau181 χ2=17.317; df=2; p<0.001 AD vs MCI - (U=183; Z=-3.712; p<0.001) AD vs HC - (U=81; Z=-0.296; p=0.789) MCI vs HC - (U=38; Z=-2.806; p=0.004) χ2=23.99; df=2; p<0.001 AD vs MCI - (U=255; Z=-1.914; p=0.056) AD vs HC - (U=32.5; Z=-4.671; p<0.001) MCI vs HC - (U=37; Z=-3.320; p=0.001) Boxes represent the median, the 25th and the 75th percentiles, bars indicate the range of data distribution The asterisks represent extreme values (value more than three boxlength from the 75th/25th percentile). Boxes represent the median, the 25th and the 75th percentiles, bars indicate the range of data distribution. Circles represent outliers (values more than 1.5 box-length from the 75th/25th percentile). The asterisks represent extreme values (value more than three boxlength from the 75th/25th percentile). Cut-off levels were derived from ROC curve analysis, when the sum of specificity and sensitivity was maximized. Statistical analyses were performed with SPSS 19.0.1 (SPSS Inc., Chicago, IL, USA). P values less than 0.05 were considered statistically significant. Conclusions •Although the follow-up of at least 5 years is needed to assess if defined cut-off levels of CSF p-tau181 and p-tau231 truly predict MCI conversion to AD, phospho-tau proteins greatly increase specificity and sensitivity of AD diagnosis. •Considering the growing number of potential treatments for AD, Croatian Institute for Brain Research with the base of more than 300 CSF samples could participate in future studies of drug response monitoring in patients. References A. K. Desai, P. Chand, Primary Psychiat., 16 (7) (2009) 40-46. I. Halperin, M. Morelli, A. D. Korczyn, et al., Neurotherapeutics 6 (2009) 128–140. H. Hampel, K. Blennow, L. M. Shaw, et al., Exp Gerontol. 45(1) (2010) 30-40. H. Hampel, G. Wilcock, S. Andrieu, et al. Prog. Neurobiol. 95 (2011) 579–593. Acknowledgements This study is funded by the Croatian Science Foundation grant no. 09/16 “Detection and tracking of biological markers for early therapeutic intervention in sporadic Alzheimer’s disease”. cut-off (p-tau231) = 1.905 U/ml cut-off (p-tau181) = 35.75 pg/ml Only 1 of 14 MCI patients (7.14%) had increased both p-tau181 and p-tau231, which indicates that this patient could progress to AD. Both p-tau181 and ptau231 were measured at only 42 patients (16 AD, 14 MCI and 12 HC).


