96x48 Poster Template - University of Southern California
advertisement
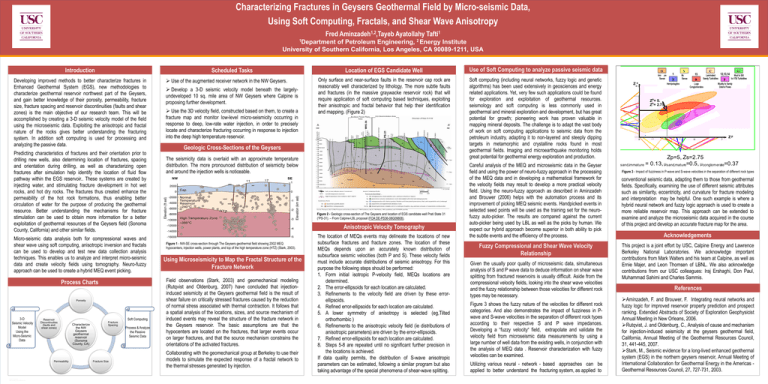
Characterizing Fractures in Geysers Geothermal Field by Micro-seismic Data, Using Soft Computing, Fractals, and Shear Wave Anisotropy Fred Aminzadeh1,2,Tayeb Ayatollahy Tafti1 1Department of Petroleum Engineering, 2 Energy Institute University of Southern California, Los Angeles, CA 90089-1211, USA Introduction Scheduled Tasks Developing improved methods to better characterize fractures in Enhanced Geothermal System (EGS), new methodologies to characterize geothermal reservoir northwest part of the Geysers, and gain better knowledge of their porosity, permeability, fracture size, fracture spacing and reservoir discontinuities (faults and shear zones) is the main objective of our research team. This will be accomplished by creating a 3-D seismic velocity model of the field using the microseismic data. Exploiting the anisotropic and fractal nature of the rocks gives better understanding the fracturing system. In addition soft computing is used for processing and analyzing the passive data. Predicting characteristics of fractures and their orientation prior to drilling new wells, also determining location of fractures, spacing and orientation during drilling, as well as characterizing open fractures after simulation help identify the location of fluid flow pathway within the EGS reservoir.. These systems are created by injecting water, and stimulating fracture development in hot wet rocks, and hot dry rocks. The fractures thus created enhance the permeability of the hot rock formations, thus enabling better circulation of water for the purpose of producing the geothermal resource. Better understanding the mechanisms for fracture stimulation can be used to obtain more information for a better exploitation of geothermal resources of the Geysers field (Sonoma County, California) and other similar fields. Micro-seismic data analysis both for compressional waves and shear wave using soft computing, anisotropic inversion and fractals can be used to develop and test new data collection analysis techniques. This enables us to analyze and interpret micro-seismic data and create velocity fields using tomography. Neuro-fuzzy approach can be used to create a hybrid MEQ event picking. Process Charts Porosity 3-D Seismic Velocity Model Using the Micro-Seismic Data Reservoir Discontinuities (faults and shear zones) Permeability TEMPLATE DESIGN © 2008 www.PosterPresentations.com Soft Computing Characterize the NW Geysers geothermal reservoir (Sonoma County, CA) Fracture Spacing Fracture Size Process & Analyze the Passive Seismic Data Use of the augmented receiver network in the NW Geysers. Develop a 3-D seismic velocity model beneath the largelyundeveloped 10 sq. mile area of NW Geysers where Calpine is proposing further development. Use the 3D velocity field, constructed based on them, to create a fracture map and monitor low-level micro-seismicity occurring in response to deep, low-rate water injection, in order to precisely locate and characterize fracturing occurring in response to injection into the deep high temperature reservoir. Location of EGS Candidate Well Use of Soft Computing to analyze passive seismic data Only surface and near-surface faults in the reservoir cap rock are reasonably well characterized by lithology. The more subtle faults and fractures (in the massive graywacke reservoir rock) that will require application of soft computing based techniques, exploiting their anisotropic and fractal behavior that help their identification and mapping. (Figure 2) Soft computing (including neural networks, fuzzy logic and genetic algorithms) has been used extensively in geosciences and energy related applications. Yet, very few such applications could be found for exploration and exploitation of geothermal resources. seismology and soft computing is less commonly used in geothermal and mineral exploration and development, but has great potential for growth; pioneering work has proven valuable in mapping mineral deposits. The challenge is to adapt the vast body of work on soft computing applications to seismic data from the petroleum industry, adapting it to non-layered and steeply dipping targets in metamorphic and crystalline rocks found in most geothermal fields. Imaging and microearthquake monitoring holds great potential for geothermal energy exploration and production. Geologic Cross-Sections of the Geysers The seismicity data is overlaid with an approximate temperature distribution. The more pronounced distribution of seismicity below and around the injection wells is noticeable. Figure 2 - Geologic cross-section of The Geysers and location of EGS candidate well Prati State 31 (“PS-31). – From Calpine-LBL proposal (FOA DE-PS36-08G09808). Anisotropic Velocity Tomography Figure 1 - NW-SE cross-section through The Geysers geothermal field showing 2002 MEQ hypocenters, injection wells, power plants, and top of the high temperature zone (HTZ) (Stark, 2003). Using Microseismicity to Map the Fractal Structure of the Fracture Network Field observations (Stark, 2003) and geomechanical modeling (Rutqvist and Oldenburg, 2007) have concluded that injectioninduced seismicity at the Geysers geothermal field is the result of shear failure on critically stressed fractures caused by the reduction of normal stress associated with thermal contraction. It follows that a spatial analysis of the locations, sizes, and source mechanism of induced events may reveal the structure of the fracture network in the Geysers reservoir. The basic assumptions are that the hypocenters are located on the fractures, that larger events occur on larger fractures, and that the source mechanism constrains the orientations of the activated fractures. Collaborating with the geomechanical group at Berkeley to use their models to simulate the expected response of a fractal network to the thermal stresses generated by injection. The location of MEQs events may delineate the locations of new subsurface fractures and fracture zones. The location of these MEQs depends upon an accurately known distribution of subsurface seismic velocities (both P and S). These velocity fields must include accurate distributions of seismic anisotropy. For this purpose the following steps should be performed: 1. Form initial isotropic P-velocity field, MEQs locations are determined. 2. The error-ellipsoids for each location are calculated. 3. Refinements to the velocity field are driven by these errorellipsoids. 4. Refined error-ellipsoids for each location are calculated. 5. A lower symmetry of anisotropy is selected (eg,Tilted orthorhombic ) 6. Refinements to the anisotropic velocity field (ie distributions of anisotropic parameters) are driven by the error-ellipsoids. 7. Refined error-ellipsoids for each location are calculated. 8. Steps 5-8 are repeated until no significant further precision in the locations is achieved. If data quality permits, the distribution of S-wave anisotropic parameters can be estimated, following a similar program but also taking advantage of the special phenomena of shear-wave splitting. Careful analysis of the MEQ and microseismic data in the Geyser field and using the power of neuro-fuzzy approach in the processing of the MEQ data and in developing a mathematical framework for the velocity fields may result to develop a more practical velocity field. Using the neuro-fuzzy approach as described in Aminzadeh and Brouwer (2006) helps with the automation process and its improvement of picking MEQ seismic events. Handpicked events in selected seed points will be used as the training set for the neurofuzzy auto-picker. The results are compared against the current auto-picker being used by LBL as well as the picks by human. We expect our hybrid approach become superior in both ability to pick the subtle events and the efficiency of the process. Fuzzy Compressional and Shear Wave Velocity Relationship Given the usually poor quality of microseismic data, simultaneous analysis of S and P wave data to deduce information on shear wave splitting from fractured reservoirs is usually difficult. Aside from the compressional velocity fields, looking into the shear wave velocities and the fuzzy relationship between those velocities for different rock types may be necessary. Figure 3 shows the fuzzy nature of the velocities for different rock categories. And also demonstrates the impact of fuzziness in Pwave and S-wave velocities in the separation of different rock types according to their respective S and P wave impedances. Developing a “fuzzy velocity“ field, extrapolate and validate the velocity field from microseismic data measurements by using a large number of well data from the existing wells, in conjunction with the analysis of MEQ data . Reservoir characterization with fuzzy velocities can be examined. Utilizing various neural - network - based approaches can be applied to better understand the fracturing system, as applied to O Y B C R Zs G P P Zp= 5. Zs= 2.75 Zp Zp=5, Zs=2.75 µsand,immature = 0.13, µsand,mature=0.5, µconglomerate=0.37 Figure 3 - Impact of fuzziness in P-wave and S-wave velocities in the separation of different rock types conventional seismic data, adapting them to those from geothermal fields. Specifically, examining the use of different seismic attributes such as similarity, eccentricity, and curvature for fracture modeling and interpretation may be helpful. One such example is where a hybrid neural network and fuzzy logic approach is used to create a more reliable reservoir map. This approach can be extended to examine and analyze the microseismic data acquired in the course of this project and develop an accurate fracture map for the area. Acknowledgements This project is a joint effort by USC, Calpine Energy and Lawrence Berkeley National Laboratories. We acknowledge important contributions from Mark Walters and his team at Calpine, as well as Ernie Majer, and Leon Thomsen of LBNL. We also acknowledge contributions from our USC colleagues: Iraj Ershaghi, Don Paul, Muhammad Sahimi and Charles Sammis. References Aminzadeh, F. and Brouwer, F. Integrating neural networks and fuzzy logic for improved reservoir property prediction and prospect ranking. Extended Abstracts of Society of Exploration Geophysicist Annual Meeting in New Orleans, 2006. Rutqvist, J. and Oldenburg, C., Analysis of cause and mechanism for injection-induced seismicity at the geysers geothermal field, California, Annual Meeting of the Geothermal Resources Council, 31, 441-445, 2007. Stark, M., Seismic evidence for a long-lived enhanced geothermal system (EGS) in the northern geysers reservoir, Annual Meeting of International Collaboration for Geothermal Energy in the Americas Geothermal Resources Council, 27, 727-731, 2003.
