6.4.23
Advice October 2013
ECOREGION
STOCK
North Sea
Northern shrimp (Pandalus borealis) in Divisions IIIa West and IVa East
(Skagerrak and the Norwegian Deep)
Advice for 2014
ICES advises on the basis of MSY considerations that catches should be no more than 6000 t in 2014. If discard rates do
not change from the average of the last three years, this implies landings of no more than 5426 t. Additionally, measures
should be taken to address highgrading.
F (Fishing Mortality)
2010 2011
2,0
2012
1970
At target
MSY (FMSY)
Precautionary
approach (Fpa,Flim)
Not defined
SSB (Spawning-Stock Biomass)
2011 2012
2013
Precautionary
approach (Bpa,Blim)
Above limit
Relative fishing mortality
FMSY
Flim
1970
1975
1980
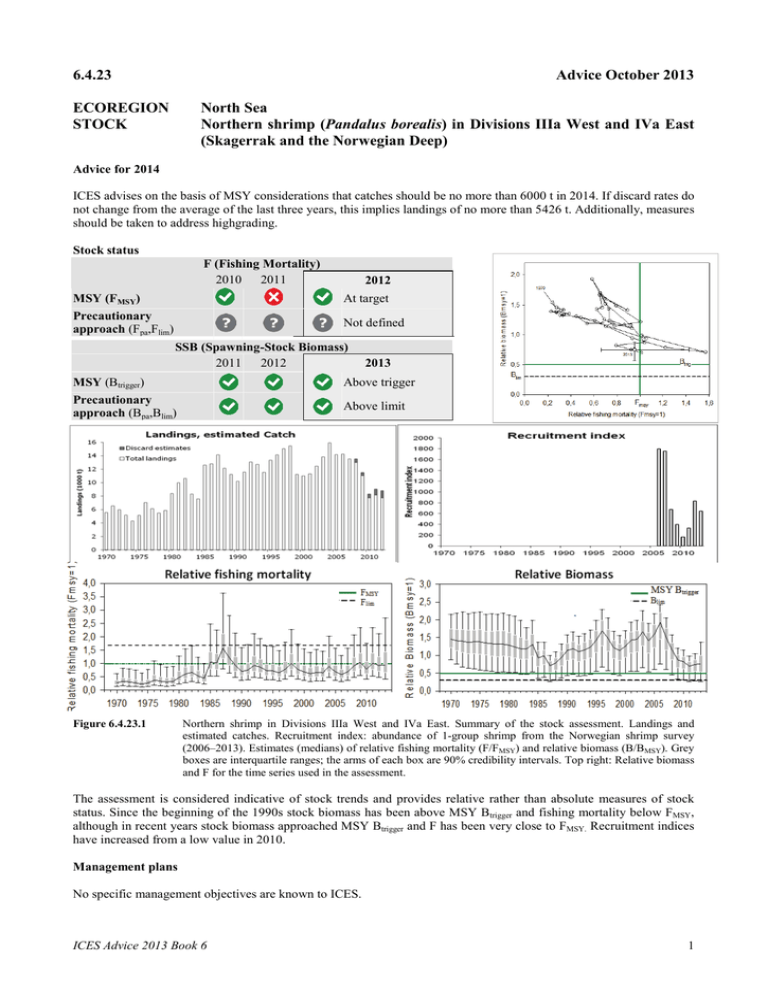
Figure 6.4.23.1
1985
1990
1995
2000
2005
2010
Relative Biomass (Bmsy=1)
Above trigger
Relative fishing mortality (Fmsy=1)
MSY (Btrigger)
4,0
3,5
3,0
2,5
2,0
1,5
1,0
0,5
0,0
Relative biomass (Bmsy=1)
Stock status
1,5
1,0
2013
Btrig
0,5
Blim
0,0
0,0
0,2
0,4
0,6
0,8
F1,0
msy
1,2
1,4
Relative fishing mortality (Fmsy=1)
3,0
2,5
Relative Biomass
MSY Btrigger
Blim
2,0
1,5
1,0
0,5
0,0
1970 1975 1980 1985 1990 1995 2000 2005 2010
Northern shrimp in Divisions IIIa West and IVa East. Summary of the stock assessment. Landings and
estimated catches. Recruitment index: abundance of 1-group shrimp from the Norwegian shrimp survey
(2006–2013). Estimates (medians) of relative fishing mortality (F/FMSY) and relative biomass (B/BMSY). Grey
boxes are interquartile ranges; the arms of each box are 90% credibility intervals. Top right: Relative biomass
and F for the time series used in the assessment.
The assessment is considered indicative of stock trends and provides relative rather than absolute measures of stock
status. Since the beginning of the 1990s stock biomass has been above MSY Btrigger and fishing mortality below FMSY,
although in recent years stock biomass approached MSY Btrigger and F has been very close to FMSY. Recruitment indices
have increased from a low value in 2010.
Management plans
No specific management objectives are known to ICES.
ICES Advice 2013 Book 6
1
1,6
Biology
Northern shrimp are hermaphroditic. Individuals start out as males, but after 2–4 years they change sex and complete
their lives as females. Several fish and marine mammal species prey on Northern shrimp and may, under certain
circumstances, be important drivers of Northern shrimp stock dynamics. Natural mortality for northern shrimp in
Divisions IIIa West and IVa East is probably higher than fishing mortality.
The fisheries
Northern shrimps are mainly caught by 35–45 mm single- and twin-trawl nets (minimum legal mesh size is 35 mm).
The targeted northern shrimp fishery in Denmark has declined over the last 20 years, whereas the Norwegian shrimp
fleet of vessels < 11 m has expanded. Swedish fishery showed an increase in the use of twin trawls since around 2007.
Due to the increasing use of twin trawl in all fisheries (and the accompanying increase in the size of the trawls), the
efficiency of the fisheries has increased.
Catch distribution
Total catches (2012) = 8834 kt, where 88% are landings (100% trawl) and 12% discards.
Effects of the fisheries on the ecosystem
When sorting grids are not used, bycatch species, dominated by saithe and cod, may constitute up to 30% of the landed
catch. In addition, the shrimp survey indicates that deep-sea species such as argentines, roundnose grenadier, rabbitfish,
and sharks are frequently caught in shrimp trawls in the deeper parts of Skagerrak and the Norwegian Deep. A
legislation requiring a species-selective grid has been implemented in the Skagerrak since 1st February 2013.
Quality considerations
Making the electronic logbooks introduced in the Norwegian fishery in 2011 compulsory for all vessels, instead of only
vessels ≥15 m (≥12 m in Skagerrak, since 2013), would result in a considerable increase in the quality of the data
available for the assessment.
The assessment model best describes trends in stock development and is not fully sensitive to year-to-year changes.
Large and rapid changes in recruitment may therefore not be fully captured in model predictions.
Scientific basis
Assessment type
Stock data category
Input data
Discards and bycatch
Indicators
Other information
Working group report
2
Bayesian fitting of a surplus-production model.
Category 1
Commercial landings (until 2007), commercial catches (since 2008), two survey indices
(Norwegian shrimp survey 1984–2002 and 2006–2013), and two commercial indices (Danish
and Norwegian standardized lpue).
Discards are included in the assessment (Norwegian, Danish, and Swedish fleets since 2008).
Swedish standardized lpue.
A length-based analytical assessment model was adopted at the 2013 benchmark meeting but
was not fully operational for providing advice for this year’s assessment. A surplus
production model was used this year instead.
NIPAG (ICES, 2013b).
ICES Advice 2013, Book 6
6.4.23
Supporting information October 2013
ECOREGION
STOCK
North Sea
Northern shrimp (Pandalus borealis) in Divisions IIIa West and IVa East
(Skagerrak and the Norwegian Deep)
Reference points
MSY
approach
Precautionary
approach
Type
Value
MSY Btrigger 0.5 of BMSY*
FMSY
*
Blim
Bpa
Flim
Fpa
0.3 of BMSY
Not defined.
1.7 of FMSY
Not defined.
Technical basis
Relative value. BMSY is directly estimated from the assessment surplus
production model and changes when the assessment is updated.
Relative value. FMSY is directly estimated from the assessment surplus
production model and changes when the assessment is updated.
Relative value.
Relative value (the F that drives the stock to Blim).
(New in 2013)
* Fishing mortality is estimated in relation to FMSY and total stock biomass is estimated in relation to BMSY.
Outlook for 2014
Basis: Catches (2013) = 9 5; median F2013/FMSY = (catch constraint) = 0.95; median B2014 > MSY Btrigger.
Catch options 2014*
6
8
10
12
14
*
Stock size (B2015/BMSY), median
0.84
0.81
0.78
0.76
0.73
Fishing mortality (F2014/FMSY), median
0.54
0.74
0.97
1.19
1.45
Probability of B2015 falling below Blim
6%
6%
6%
7%
7%
Probability of F2014 exceeding Flim
5%
10%
19%
29%
39%
Catches in thousand tonnes.
MSY considerations
The stock biomass is expected to be above MSY Btrigger in 2014. Hence, the MSY approach corresponds to fishing at
FMSY (or lower) in 2014. Catches of 10 000 t in 2014 correspond to median F2014/FMSY = 0.97. Therefore, catches of up
to 10 000 t in 2014 are considered consistent with the MSY approach. With these catches in 2014, the stock biomass is
forecast to remain above MSY Btrigger in 2015.
However, in the benchmark of this stock, concluded in 2013, two models were considered appropriate for the
assessment of this stock; a surplus production model (presented here) and a length-based model. The benchmark group
(IBPP and; ICES, 2013a) preferred the length-based model because it incorporates more data (mainly, length
information), but concluded that it was not fully operational to provide catch advice this year. Both models show similar
stock trends for most of the time-series, but the length-based model indicates a far higher fishing mortality in the last
years (Figure 6.4.23.3). ICES advice in the near future will likely be based on the length-based model, and ICES
considers that the current advice should take into account the uncertainty due to the different interpretations of recent
fishing mortality.
It should be noted that any catch value in the range 6000–10 000 t in 2014 corresponds to a 6% probability of B2015
being less than Blim. This indicates that the probability surface is very flat and, therefore, a formal 5% probability
criterion would imply a very low catch in 2014, well below any catch value observed in the last three decades, which is
considered overly restrictive. At the same time, both assessments show a substantial decrease in stock biomass in recent
years (in line with the decreases in the Norwegian survey and commercial lpue indices) and a big increase in F in the
case of the length-based assessment. Therefore, a cautious approach to the advice is required this year, until historical
stock development and current status in relation to reference points are further evaluated and confirmed by the lengthbased assessment model selected by the benchmark (IBPPand).
Taking all the above elements into consideration, ICES advises that catches in 2014 should not exceed 6000 t in
2014. If discard rates do not change from the average of the last three years (2010–2012), this corresponds to landings
of no more than 5426 t.
ICES Advice 2013 Book 6
3
Additional considerations
As many fish species prey on Northern shrimp, predators (e.g. cod and saithe) have a significant effect on the stock
dynamics of Northern shrimp.
A benchmark was finalized for this stock in 2013 (ICES, 2013a) to decide on an appropriate assessment model. The
benchmark discussed a length-based model and a surplus production model, which gave generally similar results
(except for the last years, when they show more differences) and were both considered capable of forming the basis for
the stock assessment. It was concluded that the length-based model is preferred because it made more use of the
available data from the surveys and catches, and because it is relatively easy to update and run. It was decided that the
surplus production model should be run alongside the length-based model, at least initially, to ensure that assessments
from the two models are consistent and that differences are noted and the reasons for them understood. Since the lengthbased model was not fully operational to provide catch advice this year, the surplus production model is presented as
the basis for the advice this year. However, the differences found between the preferred length-based model and the
surplus production model also influenced the advice provided.
A joint Nordic–EU project (Interreg. IV, 2011–2013) has investigated the stock structure of northern shrimp using
genetics and fisheries data through an extensive collaboration with the industry. The shrimp in Skagerrak and the
Norwegian Deep most likely comprise one single stock, which is in agreement with the oceanic current pattern in the
area. The benchmark assessment in September 2013 thus concluded that the northern shrimp in the Skagerrak and
Norwegian Deep area can be considered to belong to one single stock for assessment purposes.
The estimate of the Danish lpue is based on fishing trips where the landing value of northern shrimp was at least 50% of
the landing value of all species. This threshold was selected to ensure the exclusion of trips where northern shrimp is
landed as a bycatch rather than as a target species. Uncertainties on discards and highgrading estimates have been
reduced following discard data collection in the European Data Collection Framework.
Regulations and their effects
The main regulatory measure is a TAC, which is not fully fished by all countries. Discarding of small and mediumsized, low-value shrimp may occur in the Swedish fishery, and since around 2011 discarding of small shrimp has also
been documented in the Danish and Norwegian fisheries. The estimated discards are included in the total catch.
Minimum legal mesh size is 35 mm, but an increasing number of shrimp vessels use 45 mm mesh in the codend.
The management of northern shrimp fisheries should address the discarding of small shrimps, which occurs mainly in the
Swedish fleet due to highgrading as a consequence of a restrictive quota. In 2012, estimated discards amounted to 12% of
the total catch (1063 t discarded). Sorting grids should be mandatory in all areas to minimize bycatch. Additionally, all
vessels, including Norwegian vessels < 15 m (< 12 m in Skagerrak) that are not currently using electronic logbooks,
should be required to provide logbooks, as this would result in a considerably increase in the quality of the data
available for the assessment.
Changes in fishing technology and fishing patterns
The number of Danish shrimp vessels has decreased from 138 in 1987 to only 10 in 2013. Most of the vessels leaving
the fishery have been small trawlers. The efficiency of the Danish shrimp vessels has increased due to the introduction
of twin-trawl technology and increasing trawl size.
In the Norwegian shrimp fleet small vessels < 11 m are the most numerous, as a licence to fish is not required for
vessels < 11 m. Information on gear use (single, twin trawl) for all vessels ≥15 m (≥12 m in Skagerrak) is available
from compulsory electronic logbooks introduced in 2011.
Since 2006, the number of Swedish twin trawlers has increased from 5 to 23. These twin trawlers have 50–80% higher
catch rate compared to single trawls. In Swedish national waters it is mandatory to use trawls equipped with sorting
grids.
Comparison with previous assessment and advice
The 2012 advice was based on ICES approach to data-limited stocks, taking into account the Norwegian survey
biomass index (category 3 of data limited stocks). In 2013 ICES is providing advice on an analytical basis for this stock
(category 1), after several years without such an assessment. The advice this year is based on MSY considerations.
4
ICES Advice 2013, Book 6
Assessment and management area
This assessment is carried out for the stock in the Norwegian Deep and Skagerrak (Figure 6.4.23.2). TACs in this region
are set for Division IIIa (EU and Norwegian share) and for the Norwegian zone of the North Sea south of 62°N.
Figure 6.4.23.2
Northern shrimp in Divisions IIIa West and IVa East. Assessment areas in the North Sea and Skagerrak are
shown as dark grey. The Fladen Ground stock (light grey) is described in Section 6.4.24.
Sources
ICES. 2013a. Report of the Inter-Benchmark Protocol on Pandalus in Skagerrak and the Norwegian Deep (IBPPand),
12–19 September 2013, Dartmouth, NS, Canada. ICES CM 2013/ACOM:71. 10 pp.
ICES. 2013b. Report of the Joint NAFO/ICES Pandalus Assessment Working Group (NIPAG), 12–19 September 2013,
Halifax, Canada. ICES CM 2013/ACOM:14.
ICES Advice 2013 Book 6
5
Recruitment
Fishing mortality
Spawning Stock Biomass
Figure 6.4.23.3
6
Northern shrimp in Divisions IIIa West and IVa East. Estimates of recruitment, F1-3 and SSB from the lengthbased model. (red lines with 90% confidence intervals in grey)
ICES Advice 2013, Book 6
Table 6.4.23.1
Northern shrimp in Divisions IIIa West and IVa East. ICES advice, management, discards, landings,
and catch. In 2012 it was decided not to use discard estimates prior to 2008.
Year ICES
Advice
Predicted Predicted TAC
TAC
Discard ICES
ICES
landings catch
Norwegian estimates landings catch
corresp. corresp. Div. IIIa
zone
(discards
to advice to advice
Div. IV1
and
landings)
1987 Not assessed
14.2
1988 Catches significantly below 1985–19863
12.2
1989 No advice
3.1 2
11.2
1990 IIIa: F as F(pre-1985); IVa East:
10.0
2.75 2
10.2
No increase in F
1991 No increase in F; TAC
12.0
8.55
11.6
1992 Within safe biological limits
15 3
10.50
4.500
13.1
1993 Within safe biological limits
13 3
10.50
4.500
12.8
1994 Within safe biological limits
19 3
12.60
5.400
11.5
1995 Within safe biological limits
13 3
11.20
4.800
13.4
1996 No advice
11 3
10.50
4.500
14.1
1997 No advice
13 3
10.50
4.500
15.1
1998 No increase in F; TAC
19 3
13.16
5.640
15.5
1999 Maintain F
19 3
13.16
5.640
11.3
2000 Maintain F
< 11.5 3
9.10
3.900
11.0
2001 Maintain F
13.4
10.15
4.350
11.3
2002 Long-term average landings
12.6
10.15
4.350
12.5
2003 Maintain F
14.7
10.15
4.425
13.8
2004 No increase in F
15.3 4
10.71
4.590
16.0
2005 No increase in catch above recent level
~13 4
10.71
4.590
14.2
2006 No increase in catch above recent level
~13.5 4
11.2
4.800
14.3
2007 No increase in landings above recent level
~14.0 4
11.62
4.980
13.6
2008 No increase in landings above recent level
~15 4
11.62
4.980
0.5
13.0
13.6
2009 Same advice as last year
~15 4
11.62
4.980
0.5
11.1
11.5
2010 No increase in landings above 2008 level
~13 4
9.8
4.200
0.6
7.8
8.3
2011 At least 30% decrease in landings of 2007–
< 8.8
8.3
3.570
0.9
8.2
9.0
2009, reduce discards, mandatory sorting
grids
2012 Reduce catches and reduce discards
7.1
3.035
1.1
7.8
8.8
2013 Reduce landings by 36% and reduce
≤ 5.8
6.65
2.850
discards
2014 MSY considerations, reduce discards
≤ 5.426 ≤ 6.0
Weights in thousand tonnes.
1
TACs in the Norwegian zone of Division IVa.
2
EU zone only.
3
Catch at status quo F.
4
Single-stock boundaries and the exploitation of this stock should be conducted in the context of mixed fisheries protecting stocks
outside safe biological limits.
ICES Advice 2013 Book 6
7
Table 6.4.23.2
Year
1970
1971
1972
1973
1974
1975
1976
1977
1978
1979
1980
1981
1982
1983
1984
1985
1986
1987
1988
1989
1990
1991
1992
1993
1994
1995
1996
1997
1998
1999
2000
2001
2002
2003
2004
2005
2006
2007
2008
2009
2010
2011
2012
Denmark
*)
1102
1190
1017
755
530
817
1204
1120
1459
1062
1678
2593
3766
1804
1800
4498
4866
4488
3240
3242
2479
3583
3725
2915
2134
2460
3868
3909
3330
2072
2371
1954
2470
3270
3944
2992
3111
2422
2274
2224
1301
1601
1454
Northern shrimp in Divisions IIIa West and IVa East. Nominal landings in Division IIIa and Subarea IV;
landings, discards, and catches (in tonnes) as estimated by ICES; and the TAC (for Division IIIa and the
Norwegian zone of Subarea IV). The ICES landings are used in the assessment.
Norway
*)
1729
2486
2477
2333
1809
2339
3348
3004
2440
3040
4562
5187
5422
5370
4770
6550
6492
8343
7659
6574
6152
6104
7202
7538
6814
8019
7910
8568
9704
6737
6442
7266
7703
8177
9544
8958
8669
8685
8261
6364
4672
4801
4796
Sweden *)
2742
2906
2524
2130
2003
2003
2529
2019
1609
1787
2159
2241
1450
1136
1022
1571
1463
1322
1278
1433
1608
1908
2154
2300
2601
2882
2371
2597
2469
2445
2225
2108
2301
2389
2464
2257
2488
2445
2479
2483
1781
1768
1521
Total landings
5573
6582
6018
5218
4342
5159
7081
6143
5508
5889
8399
10021
10638
8310
7592
12619
12821
14153
12177
11249
10239
11595
13081
12753
11549
13361
14149
15074
15504
11254
11038
11328
12474
13836
15952
14207
14268
13552
13014
11071
7754
8170
7771
Estimated
Swedish
discards
540
337
386
504
683
Estimated
Norwegian
discards
93
133
246
288
Estimated
Danish
discards
TAC
Estimated
catch
41
60
129
92
15000
15000
18000
16000
15000
15000
18800
18800
13000
14500
14500
14575
15300
15300
16000
16600
16600
16600
14000
11870
10135
13554
11542
8333
9049
8834
*) Swedish (all years), Norwegian (since 2000), and Danish (since 2001) landings have been corrected for loss in weight due to
boiling.
8
ICES Advice 2013, Book 6
Table 6.4.23.3
Northern shrimp in Divisions IIIa West and IVa East. Bycatch in the shrimp fishery in 2012. Combined data
from Danish and Swedish logbooks and Norwegian landings (tonnes).
Division IIIa, no grid
Species:
Northern shrimp
Norway lobster
Anglerfish
Whiting
Haddock
Hake
Ling
Saithe
Witch flounder
Norway pout
Cod
Other market fish
ICES Advice 2013 Book 6
Total (t)
5481.4
41.1
80.7
7.4
109.3
21.7
45.7
474.6
72.6
2.2
401.2
174.7
% of total
catch
79.3
0.6
1.2
0.1
1.6
0.3
0.7
6.9
1.1
0.0
5.8
2.5
Division IIIa, grid
Total (t)
458.3
2.8
0.7
0.0
1.5
0.4
0.2
7.3
1.0
0.0
3.3
6.2
% of total
catch
95.1
0.6
0.2
0.0
0.3
0.1
0.0
1.5
0.2
0.0
0.7
1.3
Division IVa East, no grid
Total (t)
1175.4
8.7
43.6
1.3
8.2
24.0
33.5
112.6
1.5
0.0
57.4
48.5
% of total
catch
77.6
0.6
2.9
0.1
0.5
1.6
2.2
7.4
0.1
0.0
3.8
3.2
9
Table 6.4.23.4
Northern shrimp in Divisions IIIa West and IVa East. Summary of the assessment.
Median
Biomass
Biomass
lower
90%
Biomass
lower
interquartile
0.81
1.21
Relative
to BMSY
1.45
Median
F
Biomass
higher
interquartile
Biomass
higher
90%
F
lower
90%
F lower
interquartile
1.73
2.26
0.12
0.21
Relative
to FMSY
0.28
F higher
interquartile
F
higher
90%
0.37
0.75
1970
Recruitment
index
Relative
index
n/a
1971
n/a
0.67
1.13
1.41
1.73
2.31
0.14
0.25
0.34
0.47
1.02
1972
n/a
0.57
1.09
1.39
1.72
2.32
0.13
0.23
0.31
0.44
1.02
1973
n/a
0.54
1.06
1.38
1.72
2.29
0.12
0.20
0.28
0.39
0.92
1974
n/a
0.50
1.05
1.38
1.73
2.31
0.10
0.17
0.23
0.33
0.82
1975
n/a
0.49
1.03
1.38
1.73
2.32
0.12
0.20
0.28
0.40
0.99
1976
n/a
0.46
1.00
1.35
1.69
2.29
0.16
0.28
0.39
0.57
1.38
1977
n/a
0.44
0.99
1.34
1.69
2.30
0.14
0.24
0.34
0.49
1.22
1978
n/a
0.43
0.97
1.33
1.70
2.30
0.13
0.22
0.31
0.45
1.10
1979
n/a
0.42
0.98
1.33
1.69
2.31
0.14
0.24
0.33
0.48
1.14
1980
n/a
0.42
0.95
1.29
1.64
2.27
0.20
0.35
0.49
0.70
1.61
1981
n/a
0.40
0.92
1.24
1.58
2.23
0.25
0.44
0.61
0.87
1.90
1982
n/a
0.39
0.89
1.19
1.51
2.14
0.28
0.49
0.67
0.94
2.04
1983
n/a
0.39
0.90
1.19
1.44
1.89
0.24
0.41
0.54
0.74
1.52
1984
n/a
0.44
0.99
1.32
1.59
2.10
0.20
0.33
0.45
0.61
1.23
1985
n/a
0.29
0.70
0.94
1.13
1.48
0.47
0.79
1.06
1.44
2.98
1986
n/a
0.32
0.75
0.99
1.16
1.45
0.47
0.77
1.02
1.37
2.75
1987
n/a
0.22
0.53
0.71
0.84
1.06
0.72
1.18
1.57
2.13
4.36
1988
n/a
0.25
0.59
0.79
0.92
1.15
0.56
0.93
1.22
1.65
3.35
1989
n/a
0.30
0.72
0.95
1.12
1.39
0.43
0.71
0.93
1.26
2.52
1990
n/a
0.37
0.86
1.15
1.34
1.65
0.33
0.54
0.70
0.95
1.91
1991
n/a
0.39
0.90
1.19
1.40
1.73
0.36
0.58
0.77
1.03
2.05
1992
n/a
0.36
0.84
1.11
1.31
1.61
0.43
0.70
0.93
1.26
2.51
1993
n/a
0.37
0.88
1.17
1.37
1.70
0.40
0.66
0.86
1.16
2.34
1994
n/a
0.40
0.94
1.25
1.46
1.80
0.34
0.56
0.73
0.99
2.00
1995
n/a
0.47
1.10
1.44
1.69
2.08
0.34
0.56
0.73
0.98
1.96
1996
n/a
0.56
1.28
1.70
1.99
2.38
0.32
0.50
0.65
0.89
1.76
1997
n/a
0.48
1.13
1.50
1.74
2.14
0.37
0.61
0.79
1.07
2.12
1998
n/a
0.39
0.91
1.22
1.42
1.76
0.47
0.77
1.00
1.36
2.76
1999
n/a
0.36
0.86
1.14
1.33
1.62
0.37
0.60
0.78
1.05
2.12
2000
n/a
0.41
0.95
1.26
1.46
1.79
0.33
0.53
0.69
0.93
1.87
2001
n/a
0.46
1.08
1.43
1.67
2.02
0.29
0.48
0.62
0.84
1.71
2002
n/a
0.47
1.11
1.46
1.70
2.07
0.32
0.52
0.67
0.91
1.84
2003
n/a
0.55
1.27
1.67
1.95
2.36
0.31
0.50
0.65
0.88
1.75
2004
n/a
0.45
1.07
1.41
1.65
2.00
0.43
0.68
0.89
1.20
2.42
2005
n/a
0.52
1.22
1.61
1.87
2.25
0.34
0.53
0.69
0.93
1.91
2006
1800
0.64
1.47
1.93
2.21
2.47
0.29
0.46
0.59
0.78
1.55
2007
1759
0.49
1.15
1.53
1.78
2.16
0.33
0.54
0.70
0.94
1.90
2008
675
0.38
0.88
1.16
1.36
1.66
0.43
0.70
0.92
1.24
2.49
2009
398
0.28
0.66
0.88
1.03
1.26
0.48
0.79
1.04
1.40
2.83
2010
168
0.26
0.63
0.83
0.97
1.19
0.37
0.61
0.79
1.07
2.16
2011
330
0.22
0.52
0.70
0.83
1.02
0.47
0.77
1.02
1.39
2.83
2012
830
0.24
0.56
0.75
0.89
1.10
0.42
0.70
0.93
1.26
2.56
2013
647
0.21
0.54
0.76
1.00
1.51
0.35
0.66
0.95
1.42
3.40
10
ICES Advice 2013, Book 6

