Barred compared to spotted Owl diets
advertisement
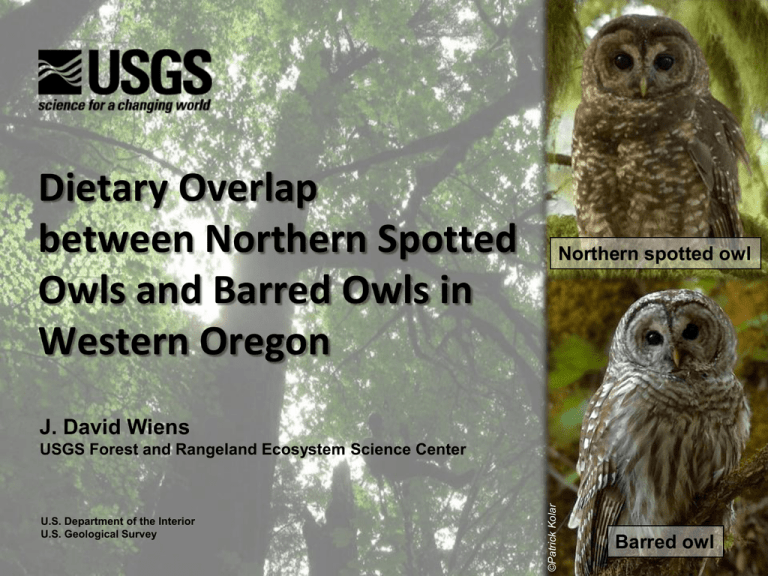
Dietary Overlap between Northern Spotted Owls and Barred Owls in Western Oregon Northern spotted owl J. David Wiens U.S. Department of the Interior U.S. Geological Survey ©Patrick Kolar USGS Forest and Rangeland Ecosystem Science Center Barred owl Management Uncertainties Associated with Barred Owls • Role in NSO population declines? • Mechanisms and magnitude of competition? • Implications to spotted owl recovery efforts and potential need to control barred owl populations? ©Patrick Kolar Primary Research Questions 1) What is the degree of resource partitioning between spotted owls and barred owls where they now co-occur? 2) Does the presence of barred owls influence resource selection, survival, and reproduction of spotted owls? ©Patrick Kolar Components of Research Spatial relationships Habitat selection Diets and foraging Overlap in resource use Influence on movements, resource selection, and fitness characteristics? Owl Interaction Study Area, 2007–2009 Oregon 40 20 0 40 Kilometers Study area = 975 km2 Kolar ©Patrick Kolar 0 1 Kilometers 2 Methods: Owl Surveys and Radio-telemetry • Conducted annual surveys of both species, 2007 – 2009 • Captured and radio-marked 29 spotted owls, 28 barred owls • Tracked owls using standardized radio-telemetry methods • Directly monitored space-use, habitat selection, and diets • Individual owls monitored for an average of 593 days (~20 months) Methods: Owl Diets • Collected owl pellets from roosts and nesting areas used by radio-marked owls • Identified prey remains in pellets using dichotomous keys and local reference collection • Estimated dietary composition by territory (n = 15 spotted owl, 24 barred owl) ©Patrick Kolar Results: Owl Surveys Spotted owl territory (15 pairs) Results: Owl Surveys Spotted owl territory (15 pairs) Barred owl territory (82 pairs) Home range size (ha) Spatial Relationships 4000 Spotted owl Barred owl 3500 3000 2500 2000 1500 1000 500 0 Breeding Nonbreeding Annual • Broadly overlapping home ranges with minimal overlap among core-use areas containing nests • Home ranges of spotted owls were 2 – 5 times larger than those used by barred owls Nighttime Habitat Selection • Both species most often foraged in patches of old (>120 yrs old) conifer forest or riparian areas containing large hardwood trees • Barred owls used available forest types more evenly than spotted owls • Overlap in use of primary forest types = 81% (range = 30 – 99%) Spotted owl (25 owls, 42 choice sets) Discrete-choice selection ratio (± 95% CI) NSO BO Barred owl (26 owls, 43 choice sets) 7 6 5 4 3 2 1 0 Young Mature Young Mature conifer conifer Old Old conifer Forest cover type 5,809 nighttime foraging locations Riparian- Hardwood hardwood Relative probability of selection Nighttime Habitat Selection 0.25 0.25 Spotted owl 0.15 0.15 0.05 0.05 0.0 Relative probability of selection Spotted owl Barred owl 0.5 1.0 Distance to nest (km) 1.5 2.0 0.30 0.0 0.40 Spotted owl 0.5 1.0 1.5 Distance to high contrast edge (km) Spotted owl Barred owl Barred owl 2.0 Barred owl 0.30 0.20 0.20 0.10 0.10 0 20 40 Slope (degrees) 60 80 0.0 0.5 1.0 1.5 Distance to stream (km) 2.0 Diets and Foraging Behavior ©AnimalSpot.net Dietary Composition (% of prey numbers) Mammal Bird Amphibian Spotted Owl 3% 1% Reptile Crayfish Barred Owl Fish Insect Mollusk 7% 13% 3% 1% 8% 95% 1,246 prey items 51 species 66% 3% 4,306 prey items 95 species Mean dietary overlap = 42% (range = 28 – 70%) Dietary Overlap by Prey Size Class Mean % of prey numbers 50 40 Spotted Owl Barred Owl 30 20 10 0 <1 1–10 11–40 41–80 81–160 161–300 Prey size class based on mean body mass (g) >300 Primary Contributors to Dietary Biomass Mean % of dietary biomass (± SE) 60 445 Spotted owl Barred owl 50 40 30 20 10 493 91 84 49 63 508 89 179 155 0 4 11 Diet Composition by Prey Activity Zone Terrestrial Semi-arboreal Arboreal Aerial Spotted owl (n=15) Aquatic Barred owl (n=24) 0 10 20 30 40 Mean % of prey biomass ( 95% CI) 50 60 ©Will Stuart Seasonal Changes in Diets, 2007 – 2009 40 % of prey numbers Breeding (Mar – Aug) Spotted owl Barred owl Dietary overlap = 45% 30 20 10 0 Nonbreeding (Sep – Feb) % of prey numbers 40 Dietary overlap = 68% 30 20 10 0 Reproductive Output 2.0 Spotted owl 0.31 (SE = 0.11, n = 14) Barred owl 1.36 (SE = 0.14, n = 20) Number young fledged/pair Number of Young Fledged per Pair Spotted owl Barred owl 1.6 1.2 0.8 0.4 0.0 2007 2008 Year 2009 • Barred owls produced 6 – 9 times as many young as spotted owls annually • All spotted owls that attempted to nest with in 1.5 km of a barred owl’s nest failed to produced young Summary of Key Findings • Barred owls outnumbered spotted owls by >4:1 • Both predators had broadly overlapping home ranges and displayed similar patterns of habitat selection within shared foraging areas • Spotted owls specialized on arboreal mammals whereas barred owls foraged opportunistically across a broad range of prey sizes and types • Both predators relied on a similar set of high-biomass prey species (e.g., flying squirrels, woodrats, lagomorphs, tree voles, deer mice) • Habitat overlap (81%) was greater than dietary overlap (42%) • Dietary overlap increased during fall and winter months • Evidence of differential foraging strategies and fine-scale habitat partitioning (terrestrial vs. arboreal prey species) Conservation Implications • Results emphasize the importance of old conifer forest and moist streamside habitats to resource partitioning • Additional loss of older forest can further constrain both species to a common set of limiting resources, thereby increasing competitive pressure • Potentially cascading effects of barred owls on other native wildlife? ©Patrick Kolar Funding Agencies and Cooperators Research Cooperators Oregon State University Boise State University Westside Ecological Roseburg Forest Products Weyerhaeuser Company Swanson Superior National Council for Air & Stream Improvement Biological Information Specialists Additional information and publications available at: www.fresc.usgs.gov/research/study_ID=547
