Extinction
advertisement
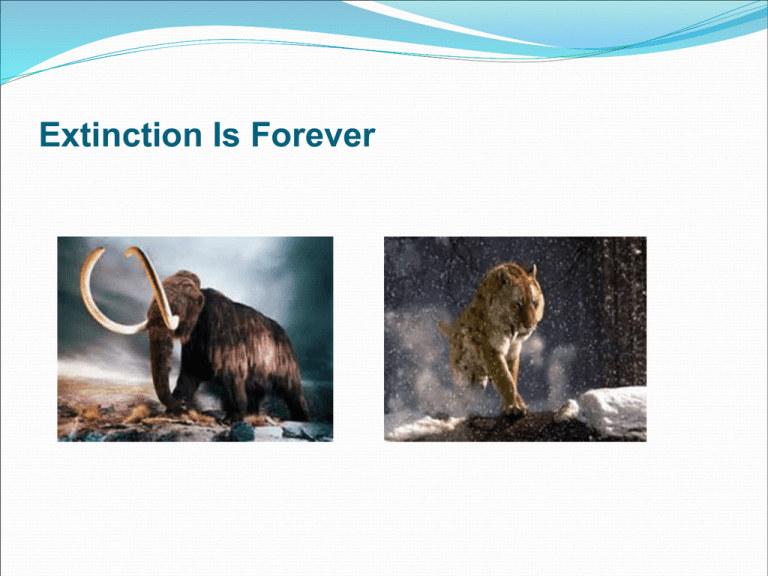
Extinction Is Forever Extinction Is Forever Passenger pigeon was hunted to extinction by 1900 when a young boy in Ohio killed the last in the wild In 1813, John James Aududon saw a huge flock that took 3 days to pass and was so dense it darkened the sky Many uses from food to feathered pillows; hunted; loss of habitat led to extinction Commercial hunters used a “Stool Pigeon”; capture one alive, sew its eyes shut and tie it to a stool – it’s bird friends came to join him and were killed or trapped in nets; hunting had become such big business that a professional trapper made $60,000 by killing 3 million birds Extinction is forever! Extinction In time, all species become extinct: Background Extinction: continuous low level of extinction Extinction Rate: % of species lost per year or 0.0001% before man became involved Mass Extinction: 5 mass extinctions – 50-95% of species were lost; but afterwards, biodiversity returned; causes include climate change, volcanoes or asteroids; man 6th? Levels of Species Extinction: Local Extinction: no longer found in an area but is found elsewhere Ecological Extinction: only a few members left and it can no longer play an ecological role in the community it is found Biological Extinction: no longer found on Earth; forever and represents an irreversible loss of the organism Figure 25.15 1,100 1,000 25 800 20 700 600 15 500 400 10 300 200 5 100 Era Period 0 E 542 O Paleozoic D S 488 444 416 359 Mesozoic P C 299 Tr 251 J 200 Cenozoic C 145 P 65.5 0 Q N 0 Number of families: Total extinction rate (families per million years): 900 Estimates of Extinction Conservative Estimates of Extinction: 0.01-1.0% which is 100-1000x the background rate before man existed 150,000 years ago Assuming a rate of 0.1% we are losing 5000 species a year if there are 5 mil species; 14,000 if 14 mil Others estimate we can lose 25% of current animal and plant species by 2050; 50% by 2100 Extinction Rates are increasing: Growth of human population will increase this loss Rates are higher where there are more endangered species Tropical forests and coral reefs, wetlands and estuaries—sites of new species—being destroyed Animal Species Prematurely Extinct Due to Human Activities Classification of Species Species that are headed for biological extinction are classified as: Endangered Species: Few individual survivors that the species can become extinct over all or part of its natural range (area found) Threatened Species: Vulnerable species Still abundant in its natural range but because of its numbers may become endangered in the near future In 2007, the Red List included 16,306 plants and animals in danger of extinction; 60% higher than 1995; may greatly underestimate the number as many species have not been classified Endangered Species Percentage of Various Species Threatened with Premature Extinction If Species Become Extinct? Instrumental value: usefulness to us in providing many of the ecological and economical services Use Value: benefits all from economic goods to science Ecotourism: wildlife tourism: generates between 950,000 to $1.8 mil per minute in tourist expenditures worldwide; male lion living to age 7 generates $515,000 in tourist dollars but only $1000 if killed for its skin Genetic Information: loss increases our reliance of small number of crop plants or animals Nonuse Value Existence Value: knowing its there even if we never see them Aesthetic Value: appreciate it for its beauty Bequest Value: pay to protect for future generations Ecological Value: species are a vital component of key ecosystem functions of energy flow, nutrient recycling and population control Protecting species from premature extinction and their vital habitats from premature environmental degradation, we are helping to sustain our own health and well being. Endangered Scarlet Macaw is a Source of Beauty and Pleasure Territorial Range of Animals The Ten Most Threatened Song Birds in the United States Medicinal Benefits of Plants Pharmacognosy:: Study of medicinal and toxic products from natural plant sources Greek surgeon Dioscorides in “De Materia Medica”, a catalog of 600 plants: Described the medicinal uses of plants Info on how and when to gather the plant Whether or not it was poisonous, its actual use and if it was edible (with recipes) Economic potential of plants It was not until the end of the Middle Ages that scholars again ventured into the field Medicinal Benefits of Plants Ethnobotany Ethnobotany: US botanist John Harshberger From “Ethnology” – study of culture and “Botany” – study of plants Scientific study of the relationships that exist between people and plants Documents, describes and explains the relationships between cultures and the uses of plants Focuses primarily on how plants are used, managed and perceived in human society Includes: foods, medicines, cosmetics and dyeing, textiles, construction, tools or currency Also, divinity, rituals, social life and literature Ethnobotany: Botanical training for the identification and preservation of plant specimens Anthropological to understand cultural concepts about the perception of plants Linguistic training, at least enough to transcribe local terms and understand native morphology, syntax and semantics Species Induction After Habitat Loss, the biggest cause of premature animal and plant extinction is the deliberate or accidental introduction of a harmful species: 7100 species have caused ecological and economic harm They threaten more than half of the 1300 endangered species in US Harmful invader species cost $261,000 per minute Species Introductions are beneficial: Food Shelter Medicine Aesthetic enjoyment Nonnative Species may have no natural: Predators Competitors Parasites Pathogens Harmful Nonnative Species Introduced into the United States Kudzu! Water Hyacinth Nile Perch – Lake Victoria Lake Victoria is a large, shallow lake in East Africa: Nile perch: deliberately introduced in the 50s and 60s to stimulate exports of fish despite warnings that the huge fish that had big appetite would reduce or eliminate species; and it did! 500 species of fish; 80% were cichlids, which were small fish that fed on detritus, algae and zooplankton; 200 are now extinct Fish were oily and could only be preserved by smoking; lost of forests for firewood Nile perch population is being reduced – reduction of food supply and being overfished! This may allow the native cichlids to come back. Nile Perch – Lake Victoria Asian Carp Asian Carp: Asian Carp species were introduced intentionally in the 1990s when catfish farms in the south were importing them to control pests. Fish have since spread throughout the Mississippi River system Millions of dollars of taxpayer money have been spent to try to keep these foreign species from swimming into the Great Lakes Some scientists say their presence in the Great Lakes would be an “Ecological Disaster Recently, evidence of an Asian Carp species was found above an electric barrier designed to prevent their movement into the Great Lakes Foreign fish breed so quickly and grow so large, they push out native fish species Notorious for being easily frightened by boats which causes them to leap high into the air; fish can jump up to 2.5–3 m (8–10 feet) into the air, and numerous boaters have been severely injured by collisions with the fish Fish are eaten in China Asian Carp Laws International Trade in Endangered Species (CITES): Bans hunting, capturing and selling of threatened or endangered species and lists 900 species that cannot be commercially traded as live specimens or wildlife products Has been signed by 172 countries Convention on Biological Diversity (BCD): Legally commits participating governments to reversing the global decline of biodiversity and to equally sharing the benefits of from use of its genetic resources Does include preventing the spread of invasive species Landmark as it focuses on ecosystems not individual species and links biodiversity protection to issues such as rights of indigenous people Ratified by 190 countries, not the US, so implementation has been slow and there is no severe punishment Endangered Species Act (ESA): Endangered Species Act (ESA): 1973 and amended in 1982, 1983, and 1985 Act identifies and protects endangered species in the US and abroad and is probably the most far reaching environmental act ever adopted by any nation, it is controversial – Canada and others have similar laws National Marine Fisheries lists ocean species while the US Fish and Wildlife Services identifies identifies and list all others; base solely on biological not economic factors From 1973 and 2007, the # rose from 92 to 1350 species – 55% plants, 45% animals; according to the Nature Conservatory, 1/3 of our species are at risk of extinction and 15% are at high risk; far more that are on the list Hot Spots: most of the rarest and most imperiled are concentrated in a few areas which conservation biologists believe should be a top priority Habitat Conservation Plan (HCP) Colony: Destroy a critical habitat but in exchange take steps to provide members of a species (protected area, move them or give money to buy area to more them too); once approved it cannot be changed even if it won’t work Endangered Worldwide Hotspots Endangered Worldwide Hotspots Confiscated Products Made from Endangered Species Deforestation Deforestation: temporary or permanent removal of large expanses of forest for agriculture, settlements or other uses In the past 8000 years, humans have reduced the original forest by 46% with most occurring in the past 60 years Global rate of forest cover loss between 1990 and 2000 was between 0.2 and 0.5% per year and at least another 0.1-0.3% were degraded every year mainly for grazing cattle and growing crops: Tropical Forests: Latin America, Indonesia, and Africa; 50,000 square miles are cleared each year or the size of Mississippi or Greece Boreal Forests: Alaska, Canada, Scandinavia, and Russia; coniferous forests are the world’s greatest or organic carbon and play a major role in the carbon cycle and in climate regulation If deforestation rates continue, 40% of remaining intact or converted forests will be logged or converted to other uses within 2 decades, if not sooner However, in the US, however, there was little change between 2000 to 2005 Clear-Cutting of Forests Deforestation Leads to Excessive Water Loss Satellite Images of Amazon Deforestation between 1975 and 2001 Protecting Our Environment
