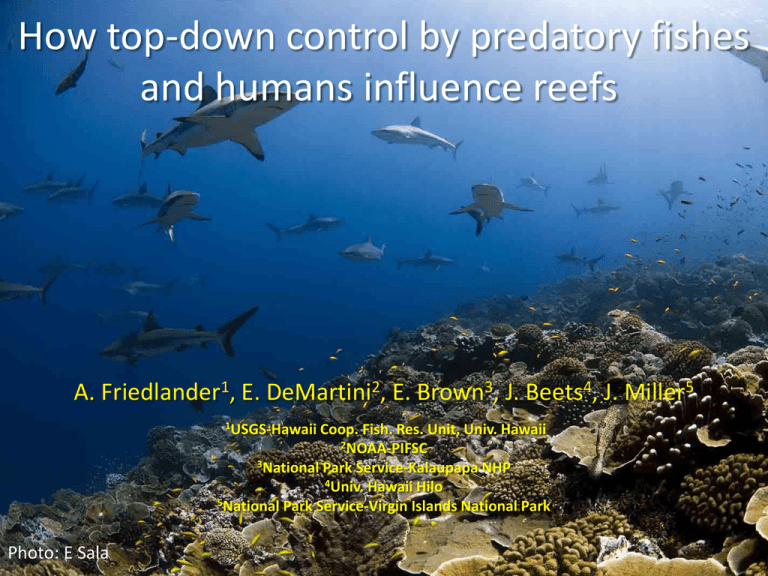
How top-down control by predatory fishes
and humans influence reefs
A. Friedlander1, E. DeMartini2, E. Brown3, J. Beets4, J. Miller5
1USGS-Hawaii
Coop. Fish. Res. Unit, Univ. Hawaii
2NOAA-PIFSC
3National Park Service-Kalaupapa NHP
4Univ. Hawaii Hilo
5National Park Service-Virgin Islands National Park
Photo: E Sala
Outline
• Coral reef ecosystem trophic structure
• Effects of fishing: direct and indirect
• Top-down control
• Consequences of predator removal
• MPAs
Photos: E. Sala
Apex predator life histories
–
–
–
–
–
Twin-spot red snapper
Lutjanus bohar
slow growth:
VBGF k = 0.2
Low mortality M = 2k = 0.4
or S = 67% per yr
late maturity: 4 yrs, 40 cm
long-lived: > 30 yrs
Grey Reef Shark
Carcharhinus amblyrhynchos
• Very slow growing
– VBGF k = 0.1
• Long-lived to > 20 yr
• Very late-maturing (age 7)
• Low fecundity
– 5 pups per yr
Prey life histories
• eg, the
banana fusilier
Pterocaesio pisang
• Rapid growth: VBGF k = 1.0
• High mortality: M=2k = 2;
equiv to A = 86% per yr (1-e-z)
• Early maturity: < age 1
• Short-lived: 1+ yr
• High turnover:
< 15-mo doubling time
• Likely higher turnover in tiny
planktivores like basslets (anthiines)
& Chromis spp damselfishes, also
gobies & blennies
Direct Effects of fishing
• Declines in:
– abundance
– size
– reproductive output
• Changes in:
– sex ratio
– behavior & distribution
Ecosystem Effects
• Changes in:
–
–
–
–
Trophic structure
Predator-prey dynamics
Reduced herbivory
Phase-shift
Trophic biomass comparisons w/in Pacific Island groups
7
6
% apex unfished = 69%
% apex fished = 20%
3.0
Line Islands
Hawaii
% apex unfished = 54%
% apex fished = 3%
2.5
Biomass (t ha-1)
Biomass (t ha-1)
5
4
3
2
Apex
2.0
Carnivores
Planktivores
1.5
Primary
1.0
1
0.5
0
0.0
NWHI
1.4
% apex unfished = 43%
% apex fished = 2%
1.8
Easter Island Grp
% apex unfished = 43%
% apex fished = 12%
1.6
1.2
MHI
Pitcairn Grp
1.4
Biomass (t ha-1)
Biomass (t ha-1)
1.0
0.8
0.6
1.2
1.0
0.8
0.6
0.4
0.4
0.2
0.2
0.0
0.0
Salas y Gomez
Easter Island
Oeno
Ducie
Henderson
Pitcairn
Production Pyramid vs.
Inverted Biomass Pyramid
Tertiary
10 units
• Production pyramid
Secondary
100 units
Primary
(herbivores)
1000 units
Tertiary
500 units
Secondary
300 units
Primary
200 units
– Classical energy flow model
– Progressive (e.g., 90%)
reduction in energy per
trophic level
• Inverted biomass pyramid
– Greater biomass of top-level
consumers
– “Non-classical” predator-prey
biomass ratios possible:
• “diffuse” predation
• High trophic efficiencies (to
20-30%) as poikilotherms
• disparate turnover (growth
and mortality) rates of prey
vs top predators
2 Grouper Species Differ in Harvest Pressure & Average
Maximum Size - Competitive release of small predators
C. argus
- 60 cm
Peacock hind
Darkfin hind
70
60
60
50
50
40
40
30
30
20
20
10
10
0
0
KIN PAL TAB KIR
KIN PAL TAB KIR
• Peacock hind: KIN = PAL = TAB > KIR
– 1-way anova: F3,97 = 10.8, p < 0.0001
• Darkfin hind: KIR = TAB > PAL = KIN
– 1-way anova: F3,97 = 19.4, p < 0.0001
Biomass density (kg ha-1)
Biomass density (kg ha-1)
70
C. urodeta
25-30 cm
Loss of large groupers and rise of meso-carnivores
around St John, Virgin Islands
Frequency
0.18
M. venenosa
M. tigris
0.16
M. interstitialis
0.14
Small groupers
0.12
0.7
0.6
0.5
0.4
0.10
0.3
0.08
0.06
0.2
0.04
0.1
0.02
0.00
0
89 90 91 92 93 94 95 96 97 98 99 00 01 02 03 04 05 06 07 08 09 10 11
Frequency
0.20
33
600
E Kingman
A Kingman
94%
Planktivores
Piscivores
400
n = 20.2
n = 1,979
200
4
2
0
20 40 60
600
33
150
B Palmyra
0
F Palmyra
92%
n = 14.0
n = 1,614
400
10 20 30 40 50 60
45
30
15
4
200
2
0
0
18
600
85% G Tabuaeran
n = 35.3
C Tabuaeran
n = 1,480
400
45
30
15
4
200
2
0
0
13
600
73% H
D Kiritimati
n = 70.4
n = 2,677
400
Kiritimati
Planktivore count (n x 1000)
0
0
Piscivore count (n)
Piscivore-Prey
TL Distributions
45
30
15
• Piscivore lengths shifted
left by extraction
k-sample median test: p < 0.001
• Planktivore prey < 10 cm
– more numerous at KIR
release from piscivory
– larger at TAB-KIR release from piscivory
– Median TL = 3 cm at all
but more of smallest prey
at KIN-PAL vs TAB-KIR
– median test: p < 0.001
45
30
15
4
200
2
0
0
0
20 40 60
150
0
10 20 30 40 50 60
Total length class (TL, cm)
DeMartini et al. 2010
Associated life history changes with changing predation pressure
40
Kingman
30
Bridled parrotfish, Scarus frenatus
TP Ch. sordidus
TP Sc. frenatus
20
10
0
20
30
40
50
60
Bullethead parrotfish, Chlorurus sordidus
Frequency count
120
80
40
0
80
Tabuaeran
60
40
20
0
• Median size sex change smallest at KINPAL & largest at TAB-KIR
60
Kiritimati
50
TP Ch. sordidus
TP Sc. frenatus
40
30
20
• k-sample median tests: p < 0.0001
• S. frenatus = KIR > TAB > PAL = KIN
• C. sordidus = KIR > TAB > PAL = KIN
10
0
20
30
40
50
Total length class (TL, cm)
DeMartini et al. 2010
60
Predator biomass
Palmyra
160
16
14
0.48
12
0.46
10
0.44
8
6
0.42
0
Fraction of max. length
MHI
0.43
16
0.42
15
0.41
14
0.40
13
0.39
12
0.38
11
0.37
10
0.36
0.35
Average prey size smaller
in fished areas but max. size
w/in species > owing to the
lack of natural predation
2
0.38
NWHI
Fraction of max length
w/in species & avg
size of prey species
4
Fraction max.
Avg. prey size
Fraction max.
Avg. prey size
Average prey size
0.40
Avg. prey size
Fraction of max. length
0.50
Changes in body size likely
important for energetics of
entire ecosystem through
higher turn-over rates &
greater ecosystem efficiency
9
8
Kingman
Palmyra Tabuaeran Kiritimati
Raffaelli & Friedlander 2012
Territorial herbivore response to piscivory
60
0.35
Terr. Damselfish
0.30
Turf algae
50
40
0.25
0.20
30
0.15
20
0.10
0.05
10
4.5
1.7
0.4
0.2
0.00
0
Kingman
Palmyra Tabuaeran Kiritimati
Apex predator biomass
• Territorial damselfishes more abundant in absence of predation
• Terr. damselfish F3, 97 = 10.2 p<0.001 KIR ≥ PAL = TAB > KIN
% cover
Biomass (t ha-1)
0.40
Apex predator biomass (t ha -1)
Apex predator biomass by MPA area in the
Hawaiian Archipelago
1.4
1.2
1.0
0.8
0.6
0.4
0.2
0.0
0
10
20
30
2000
MPA area (km2)
2200
2400
Conclusions
•
Local human impacts, even at moderate levels,
fundamentally change fish assemblage structure &
function
–
–
–
–
•
•
Loss of apex predators
Changes in size structure
maturation schedules (parrotfish size-at-sex change)
Release of lower trophic levels
Fishing indirectly alters prey population dynamics by
reducing top-down control of prey by predators
Without a baseline of how coral reefs used to look,
we lack the capacity to adequately manage these
resources in the future (“shifting baseline”).
Thanx


