Symbiosis & Ecology: Population Dynamics & Relationships
advertisement
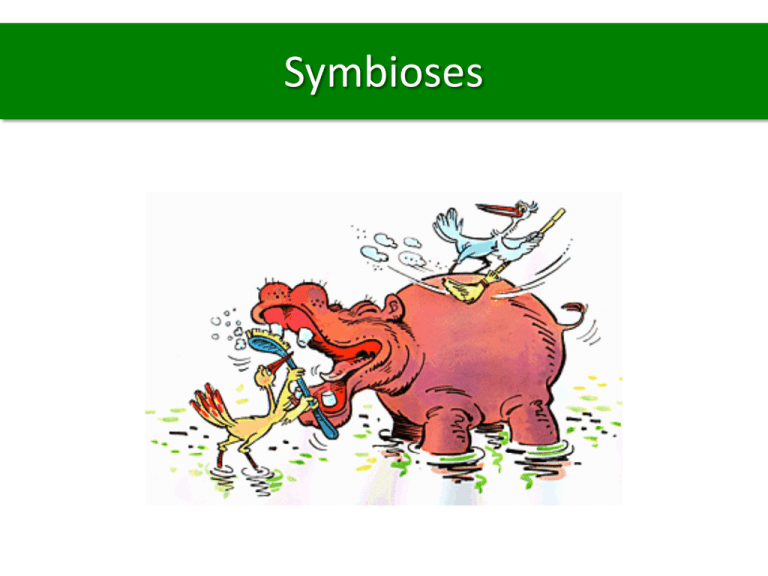
Symbioses Question of the Day Question: Give examples of exponential and logistic growth. (Hint: Use your notes!) Answer: … … … Biosphere Observations Frequently Missed Questions The rates that affected the yeast population in our lab were (mark all that apply): a. Emigration b. Immigration c. Natality d. Mortality 3. Natality- measure of the # of births in a population; birth rate 4. Mortality- measure of the # of deaths in a population; death rate Frequently Missed Questions What was the doubling time from 1980 – 1990 for the human population? a. 14 years b. 37 years c. 70 years d. 140 years = 1.96 = 36 Frequently Missed Questions Suppose you have to do two dilutions of your yeast culture before you are able to count the yeast cells. If you count 48 cells in the diluted sample, how many yeast cells were in the same area of the undiluted sample? a. b. c. d. e. 4.8 48 480 4800 48000 48 * 10 * 10 = 4800 (1st dilution) (2nd dilution) Unit 2 Vocabulary 30. Pyramid of numbers- shows the relative number of individual organisms at each trophic level in an ecosystem Unit 2 Vocabulary 31. Pyramid of mass (pyramid of biomass)- shows the relative amount of matter contained within each trophic level Unit 2 Vocabulary 32. Pyramid of energy- shows the relative amount of energy contained within each trophic level 33. 10% rule- only 10% of energy is transferred from one trophic level to another; the rest is lost, especially as heat Unit 2 Vocabulary 39. Mutualism- a relationship in which both organisms benefit +/+ A bee drinks nectar and pollinates a flower: 38. Commensalism- a relationship in which one organism benefits and the other is neither helped nor harmed +/0 Birds eat insects that are disturbed as water buffalo travel: Unit 2 Vocabulary 42. parasitism- relationship in which one organism lives inside or on another and harms it +/- Leech on skin: 43. host- the organism that provides a parasite with nutrition Humans are hosts of tapeworms: Unit 2 Vocabulary 23. niche- the range of physical and biological conditions in which a species lives and the way the species obtains what it needs to survive and reproduce 3 species with their own niches in one tree: Videos p. 148 # 17, 20, 21, 24 17. What would happen to a population of predators if there was a sudden increase in food for the prey? Explain. 17. If there is a sudden increase in food for a population of prey, the prey population will increase. This means there will be more food for the predators, which will then also increase. 20. How is the relationship between parasites and their hosts similar to a predator-prey relationship? 20. The relationship between parasites and their hosts is similar to a predator-prey relationship because in both cases the two species involved limit one another’s population growth. p. 148 # 17, 20, 21, 24 21. How would a drop in the water level of a river affect a fish population living in that river? 21. A drop in the water level of a river would affect a fish population in that river because the fish population’s density increases. This makes the fish population more susceptible to density-dependent limiting factors. 24. How can you account for the fact that the human population has grown more rapidly during the past 500 years than it has at any other time in history? 24. The human population began growing more rapidly 500 years ago due to conditions that made survival more likely, thereby decreasing the death rate. Reliable food supply, improved sanitation, and better medical care are three factors that caused this change. p. 102, Analyzing Data #1, 2, 3 1. Suppose a bacterial infection kills off most of the prey at point B on the graph. How would this affect the predator and prey growth curves at point C? At point D? 1. If most of the prey were killed off at point B, the predator population would decline between points B and C, allowing the prey population to increase again by point C. 2. Suppose a sudden extended cold spell destroys almost the entire predator population at point F on the graph. How would the next cycle of the prey population appear on the graph? 2. The prey population would increase in the next cycle, reaching a peak that is potentially even higher than the previous peaks. p. 102, Analyzing Data #1, 2, 3 3. Suppose a viral infection kills all the prey at point D on the graph. What effect would this have on the predator and prey growth curves at point E? What will happen in future years to the predator population? How could ecologists ensure the continued survival of the predators in this ecosystem? 3. If a viral infection kills all the prey at point D, at point E, the prey population will be zero and the predator population would be decreased, possibly to zero. In future years, if the predators find another food resource, the population may recover. The predator population would not recover in future years without any prey to feed on. To ensure continued survival of the predators in this ecosystem, ecologists could control the viral infection in the prey so that not all of them are killed by the virus, or they could introduce new prey animals to the ecosystem. p. 150, Analyzing Data # 34, 35 34. In which of the following years was the rabbit population density in South Australia most dense? 34. b. 1952 35. European rabbit fleas were introduced in the late 1960s to help spread the ffects of the rabbit disease myxomatosis. Based on the graph, what can you infer about the rabbit population after the fleas were introduced? 35. b. The rabbit death rate increased. Unit 2 Vocabulary 36. Primary productivity- a measure of the synthesis of compounds like sugar; usually happens through photosynthesis a. Gross primary productivity- how much chemical energy producers create in a given amount of time Unit 2 Vocabulary 36. Primary productivity- a measure of the synthesis of compounds like sugar; usually happens through photosynthesis a. Gross primary productivity- how much chemical energy producers create in a given amount of time b. Net primary productivity- how much chemical energy producers create after subtracting what chemical energy the producers use themselves
