Resina
advertisement
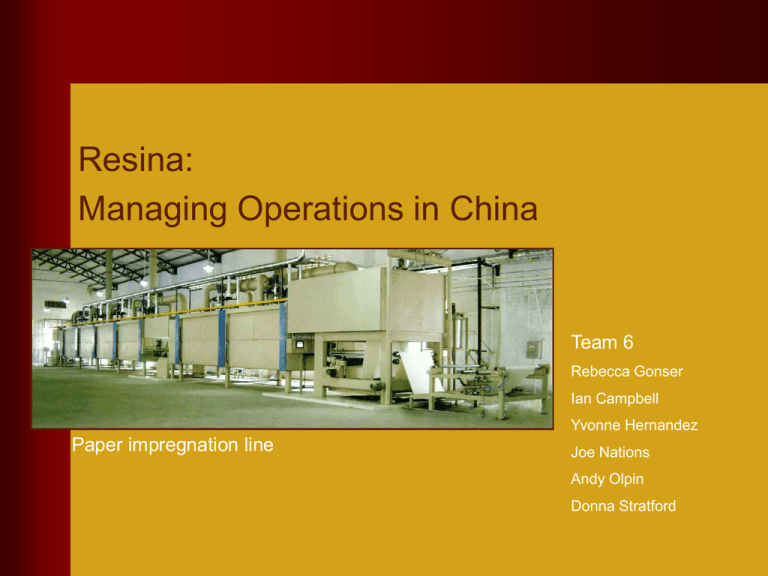
Resina: Managing Operations in China Team 6 Rebecca Gonser Ian Campbell Yvonne Hernandez Paper impregnation line Joe Nations Andy Olpin Donna Stratford History of Resina Resina Roots Paulsen Norge formed in 1949 as formaldehyde maker Auvo Chemicals founded in 1971 Auvo purchased by Sabel Investerings in 1999 Auvo and Paulsen merged in 2000 Organic growth and acquisitions and mergers 2005: $1Billion dollar 5% of the world market of global panel board resins market What Do They Make Two divisions 35 Resin product lines Brand name Kova Three main categories Industrial and surfacing Resins (48% revenue) Insulation, construction, automobile brakes, foam, filters Wood & Specialty adhesives (24% revenue) Beams, floors, furniture Paper overlays (28% of revenue) Used in plywood, particle board, MDF production High quality, resin impregnated paper branded Styrka by Resina Customers Customers Small and large panel board producers Furniture makers, building material suppliers Manufacturing Manufacturing in 25 countries 51 manufacturing plants 3.5 million tons of resin per year 500 million sq meters of paper per year Plants are wholly owned, joint venture or minority interest (20 to 50%) Resina Strategy Build production facilities close to customers Local products for local markets Minimize supply chain Growth by acquisition or organic growth Aim for higher margin added value products market Resina sales by region Sales by region 600 500 $ Million 400 europe America 300 Asia Oceana 200 100 0 2002 2003 Year 2004 Profitability Sales and profitability 1200 1000 $ Million 800 600 400 200 0 2002 2003 2004 -200 Year Low margins Loss making Mainly commodity product – 51% panel board Financials and competition Highly competitive market with low barriers to entry Competitors with similar strategies and same low margins Consolidation in the resin industry – Resina is mid size player Resina in China Resina in China Selling product since the 1950’s First production in Singapore in 1970 Opened plant in Shanghai in 2002 – source factory Beijing and Guangdong followed Shanghai only plant profitable Beijing demand flat and has transportation costs issue Guangdong plant under capacity and has low demand for it’s high quality output Growth in China adhesive market china sales of board adhesive 600 500 $ Million 400 300 200 100 0 1985 1990 2000 year China has went from net importer to large exporter of plywood and board products 2005 Beijing plant issues City wants to move industrial area Location means expensive shipping to market which cuts margin Options move plant close plant or invest Move $20M Close around $6 JV partner agreement Guangdong Plant Issues Wholly owned Local partner pulled out before construction Incomplete analysis of market and selected location before construction Local market Sales half of what was expected Options close plant or work to increase sales Strategic Reason for Site High Lead Source Contributo r Server Offshore Outpost Low Access to low-cost production Access to skills and knowledge Proximity to market Recommendations Make factories more autonomous and empower local management to identify opportunities in Asian region Invest in Shanghai to make it a Lead instead of Contributor factory Retain Guangdong plant and build customer base by tailoring product line to local needs Invest resources to make a Contributor factory Bring in local management team based on Shanghai model Relocate Beijing plant to industrial belt between Shanghai and Beijing (possibly Qingdoa) Recommendations Beijing Facility For new facility in (possibly) the Qingdoa area use Weighted - Factor and Center of Gravity models in the decision process Factor identification and weighting will be decided by a multi-disciplinary team considering all facets of the business, marketing, production, HR Significant business clusters exist in the belt from Shanghai to Bejing Start small and expand as the market grows Facility can still serve the Beijing market and be more profitable by serving local customers Questions
