4 - aqtim
advertisement

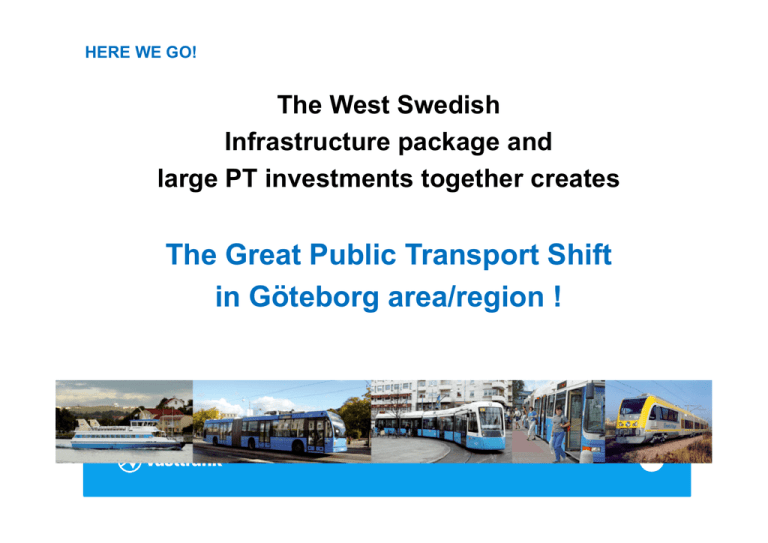
HERE WE GO! The West Swedish Infrastructure package and large PT investments together creates The Great Public Transport Shift in Göteborg area/region ! Bengtsfors Gullspång Strömstad Dals Ed Åmål Mellerud Tanum Töreboda Färgelanda Mariestad Munkedal VÄNERSBORG THIS IS OUR MARKET! • The County of Västra Götaland Lysekil • 1.5 million inhabitants Orust • 49 municipalities Tjörn Sotenäs Öckerö Götene Lidköping Uddevalla Grästorp Trollhättan Tibro Skara SKÖVDE Hjo Vara Essunga Falköping Lilla Edet Tidaholm Stenungsund Vårgårda Herrljunga Ale Kungälv Alingsås Ulricehamn Lerum Partille BORÅS Härryda Mölndal GÖTEBORG Kungsbacka Mark Karlsborg Tranemo Svenljunga 750,000 journeys a day 240 trams 71 trains Around 650 vehicles 1,614 buses 31 ferries Trunk bus system • 18 – 24 meter 6 WE PROCURE ALL SERVICES THROUGH COMPETITION (THE PUBLIC PROCUREMENT ACT) • 25 contractors for regular public transport services, and around 60 companies for the Dial To Ride service • 6,500 people work with us, with around 250 of them Västtrafik’s own staff B På uppdrag av våra ägare organiserar och utvecklar vi kollektivtrafiken Det O U R V I iSVästra I O N Götaland. : gör vi genom att ta reda på resenärernas behov The natural choice och köpa den trafik som behövs. Verksamheten for travelling finansieras genom biljettintäkter och ersättning från ägarna. jan febr mars april maj juni juli aug sept okt nov dec jan febr mars april maj juni juli aug sept okt nov dec jan febr mars april maj juni juli aug sept okt nov dec jan febr mars april maj juni juli aug sept okt nov dec jan febr mars april maj Antal delresor (1000-tal) Antal delresor Löpande 12-månaders värde år 2005-2009 225 000 220 000 215 000 210 000 205 000 200 000 195 000 190 000 185 000 180 000 175 000 År 2005 År 2006 År 2007 År 2008 År 2009 10 VÄSTTRAFIK Sales: SEK 6 billion Self-financing level: 55 % Number of journeys: 220 million/year Owned by: the Västra Götaland Region and 49 municipalities in Västra Götaland Number of employees: around 247 6,500 people work with us Västtrafik will double ridership between 2006-2025 Målbild 2025 Skaraborg Västtrafik will double ridership between 2006-2025 1,4 1,4 1,5 Lokal 3 1,4 2 Västtrafik will double ridership between 2006-2025 1,4 1,4 1,5 Lokal 3 1,4 2 Regional train 3 Västtrafik will double ridership between 2006-2025 1,4 1,5 Lokal 3 2 1,4 1,4 Regional train Total 3 2 Årlig resandeökning i (%) _09 _10 _11 _12 _13 Gbg Stadst. 3,0% 3,0% 3,0% 3,0% 8,0% Gbg Regiontr. 3,5% 3,5% 3,5% 3,5% 12,0% Fyrbodal -2,8% 2,0% 2,0% 2,0% 2,0% Sjuhärad 1,8% 1,8% 1,8% 1,8% 1,8% Skaraborg AO Region 1,8% 4,5% 1,8% 4,5% 1,8% 4,5% 1,8% 4,5% 1,8% 23,0% Västtrafik 2,7% 3,0% 3,0% 3,0% 7,9% Faktor 13/06 1,30 1,34 1,00 1,21 1,13 1,46 1,28 _14 _15 _16 _17 _18 _19 _20 _21 _22 _23 _24 _25 5,0% 3,0% 3,0% 3,0% 3,0% 3,0% 4,0% 4,0% 4,0% 5,0% 5,0% 5,0% 6,0% 3,5% 3,5% 3,5% 3,5% 3,5% 3,5% 4,0% 4,0% 4,0% 5,0% 5,0% 2,4% 2,4% 2,4% 2,4% 2,4% 2,4% 2,4% 2,4% 2,4% 2,4% 2,4% 2,4% 1,8% 1,8% 1,8% 1,8% 1,8% 1,8% 1,8% 1,8% 1,8% 1,8% 1,8% 1,8% 1,8% 1,8% 1,8% 1,8% 1,8% 1,8% 1,8% 1,8% 1,8% 1,8% 1,8% 1,8% 4,5% 4,5% 4,5% 4,5% 4,5% 4,5% 6,0% 6,0% 7,0% 7,0% 7,0% 15,0% 4,8% 3,0% 3,0% 3,0% 3,0% 3,0% 3,8% 3,8% 3,9% 4,6% 4,7% 5,0% Faktor 25/06 2,06 2,16 1,32 1,49 1,40 3,00 2,00 West Swedish Infrastructure Package • A € 3.5 billion Infrastructure package over 15 years • 50 % government financed, 40 % from congestion charges and 10 % by municipalities & regional authority • Investments mainly to improve PT infrastructure Large investments Västlänken Marieholmstunnel New Göta älv brigde Train tunnel under Göteborg Road tunnel under Göta Älv Important central connection over the river K2020 Investments for PT Efficient transport system Accessibility, environmental impact, Transport safety ITS Traffic disturbance Behavior changes Knowledge, information Congestion charge area Weekdays 06.00 - 18.30 Max 60 SEK per day Several passages per hour The fee varies throughout the day! 8, 13 and 18 SEK per trip Expected results Traffic flow in City center 2006-2013 Traffic flow in City center 2013 Traffic flow in Gothenburg area 2006-2013 Traffic flow in Gothenburg area 2013 Changed number of vehicles per day that pass the toll stations 2013 Changed average speed 2013 Decreased traffic flow E6 2013 +7 % -10 % +9 % -4 % -20 % + 7 km/h -15 % K2020 – Ridership goal År Gbg city Gbg Region 2010 3,0% 4,7% 2011 3,0% 4,7% 2012 3,0% 4,7% 2013 8,0% 12,0% Totalt 18% 27% Express bus system 2013 Trunk bus system 2013 24 Bus, tram and pedestrians at ground level and traffic underground Priority and new infrastructure Preparation for congestion charges • More commuter trains (22), longer platforms and longer trains • The Ale route commuter trains • More regional trains (12) Twin city commuter • More trams (25+25) - greater frequency Investments until 2013 Platform extensions Accessibility, national roads PT and bicycle accessibility, Gbg City Park and Ride facilities Trimming measures, state roads Traffic safety and noise measures, Gbg City Information Transport system (DART) Market incentives and services (MIIT) 345* 495 350 100 96 150 75 40 Bus lanes 2009; 36 km Bus lanes 2013; 91 km Park and Ride Västtrafik is responsible for building: 2000 new spaces for bikes 2000 new parking spots At 40 sites Doubling the number Budget 100 million SEK 2010-2013 Västtrafiks styrelse 30 Facilitate Shift in Travel Patterns Quality-assured real-time and disturbance information: • • • Bus stops and interchange points Park and ride sites Trains Development of travel services for PT and car users through mobile phone applications Bicycle travel planner 31 Our goals for 2013 are… • • • • • Significant improvements in journey time, comfort, simplicity and dependability Great steps towards paradigm shift/PT shift The number of journeys have increased according to the ridership goal Lowering the threshold for public transport Public transport's competitiveness will be strengthened Prioritized areas Improvement in Traffic/More traffic Bus/Train/Tram depots Infrastructure investments: bus lanes Vehicles Västtrafiks styrelse 32


