Facts & figures - Wetterskip Fryslân
advertisement
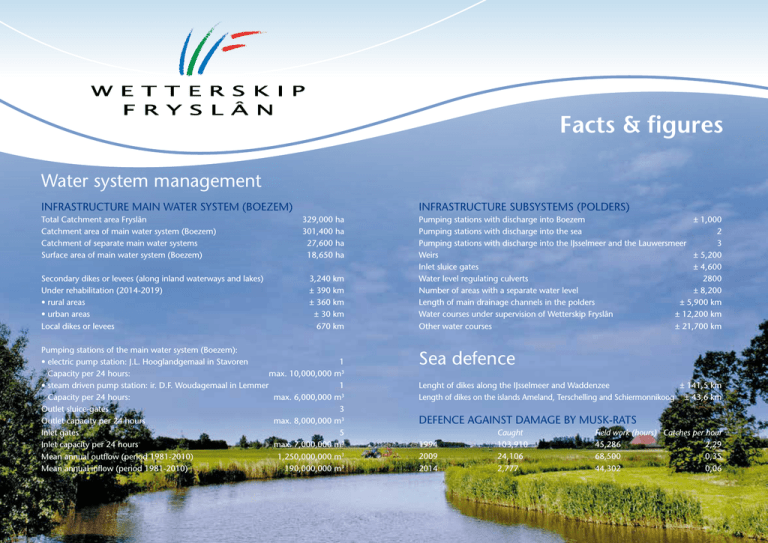
Facts & figures Water system management INFRASTRUCTURE MAIN WATER SYSTEM (BOEZEM) Total Catchment area Fryslân Catchment area of main water system (Boezem) Catchment of separate main water systems Surface area of main water system (Boezem) Secondary dikes or levees (along inland waterways and lakes) Under rehabilitation (2014-2019) • rural areas • urban areas Local dikes or levees INFRASTRUCTURE SUBSYSTEMS (POLDERS) 329,000 ha 301,400 ha 27,600 ha 18,650 ha 3,240 km ± 390 km ± 360 km ± 30 km 670 km Pumping stations with discharge into Boezem ± 1,000 Pumping stations with discharge into the sea 2 Pumping stations with discharge into the IJsselmeer and the Lauwersmeer 3 Weirs ± 5,200 Inlet sluice gates ± 4,600 Water level regulating culverts 2800 Number of areas with a separate water level ± 8,200 Length of main drainage channels in the polders ± 5,900 km Water courses under supervision of Wetterskip Fryslân ± 12,200 km Other water courses ± 21,700 km Pumping stations of the main water system (Boezem): • electric pump station: J.L. Hooglandgemaal in Stavoren 1 Capacity per 24 hours: max. 10,000,000 m3 • steam driven pump station: ir. D.F. Woudagemaal in Lemmer 1 Lenght of dikes along the IJsselmeer and Waddenzee ± 141,5 km Capacity per 24 hours: max. 6,000,000 m3 Length of dikes on the islands Ameland, Terschelling and Schiermonnikoog ± 43,6 km Outlet sluice-gates 3 Outlet capacity per 24 hours max. 8,000,000 m3 DEFENCE AGAINST DAMAGE BY MUSK-RATS Inlet gates 5 Caught Field work (hours) Catches per hour Inlet capacity per 24 hours max. 7,000,000 m3 1994103,910 45,286 2,29 3 200924,106 68,500 0,35 Mean annual outflow (period 1981-2010) 1,250,000,000 m 3 20142,777 44,302 0,06 Mean annual inflow (period 1981-2010) 190,000,000 m Sea defence Water quality Financial information WATER QUALITY MONITORING NETWORK NET CHARGES Number permanent sample locations Official locations for swimming Chloride sample locations (monitoring salinization) 175 31 72 TAXES 2014 Number of pumping stations Length of pipes under pressure Number of waste water treatment plants Average volume of treated waste water per year Total capacity of treated waste water expressed in population equivalents (one population equivalent is 150 g COD per day) Removal efficiency of organic material (BOD) Removal efficiency of phosphate Removal efficiency of total nitrogen Number of sludge dewatering plants Capacity sludge filter presses (in tons dry weight per year) 276 814 km 28 85 mln. m3 1,394,453 99 % 86,8 % 87,8 % 1 17,000 MANAGEMENT OF CONTAMINATED SEDIMENTS Sediment not appropriate for reuse Restored sites (since 1995) • Removed contaminated sediment ± 302,250 m3 20 ± 400,750 m3 Management of waterways (shipping) Length of waterways Provence of Fryslân and the Westerkwartier region € 133,300,000 € 83,100,000 € 50,200,000 ± 167 km WATER SYSTEM MANAGEMENT Residents (per housing unit) Buildings, protected by dikes (percentage of real estate value) Buildings, not protected by dikes (percentage of real estate value) Agricultural land, not protected by dikes, no polder (per ha) Agricultural land, not protected by dikes, no polder, roads (per ha) Agricultural land, not protected by dikes, polder (per ha) Agricultural land, not protected by dikes, polder, roads (per ha) Agricultural land, protected by dikes, no polder (per ha) Agricultural land, protected by dikes, no polder, roads (per ha) Agricultural land, protected by dikes, polder (per ha) Agricultural land, protected by dikes, polder, roads (per ha) Natural area (per ha) Pollution tax (per unit polluted) WASTEWATER MANAGEMENT Tax wastewater management (per unit polluted) € 80,01 0,0632 % 0,0158 % € 10,71 € 53,54 € 32,12 € 74,96 € 42,83 € 85,66 € 64,25 € 107,08 € 4,40 € 56,02 € 56,02 Personnel Formation in f.t.e. (full time equivalents) Number of employees 542 559 Surface control area: More than 355,000 ha (Provence of Fryslân including the 4 Frisian ‘Wadden Islands’ and a part of the Westerkwartier region in the Province of Groningen) Number of municipalities: 27 Number of residents: ± 670,000 March 2015 WASTEWATER TREATMENT Total net charges Net charges water system management Net charges wastewater management
