LauraLindseyStepUpSoyJan13inservice
advertisement
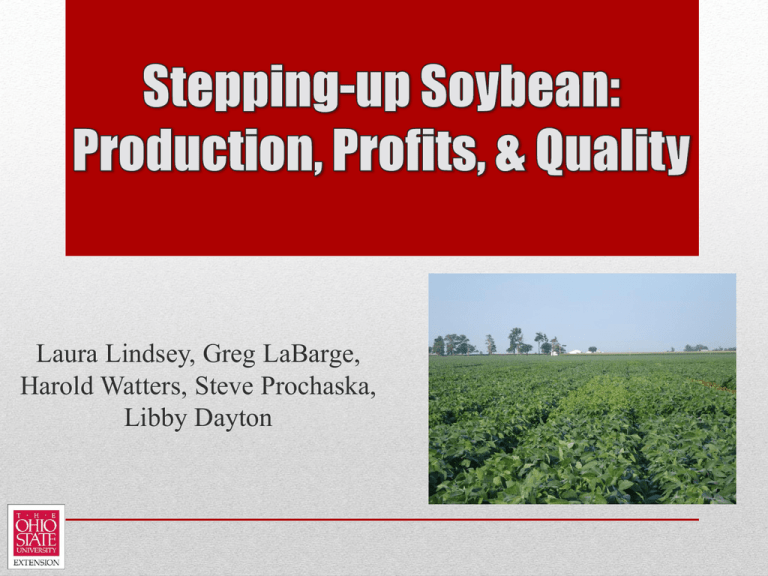
Laura Lindsey, Greg LaBarge, Harold Watters, Steve Prochaska, Libby Dayton • Funded in 2013 by Ohio Soybean Council • Co-PIs- Laura Lindsey, Greg LaBarge, Harold Watters, Steve Prochaska, Libby Dayton • Other key personnel- John McCormick, graduate student, Extension Educators Extend information to Ohio soybean growers 1. Omission Trials • On-farm (large plot) research 2. Statewide survey of yield-limiting factors • Help identify cooperators • Help collect soil/plant samples and yield information Ohio Soybean Yield from 1924-2012 Soybean yield (bu/ac) 60 50 40 30 20 10 0 1920 1940 1960 1980 Year 2000 2020 NASS Ohio Soybean Yield from 1924-2012 Soybean yield (bu/ac) 60 50 40 30 Ohio soybean yield increased 0.37 bu/ac per year from 1924-2012 20 10 0 1920 1940 1960 1980 Year 2000 2020 NASS Ohio Soybean Yield from 1924-2012 Soybean yield (bu/ac) 60 50 40 30 20 10 0 1920 Ohio soybean yield increased 0.37 bu/ac per year from 1924-2012 U.S. soybean yield increased 0.34 bu/ac per year from 1924-2012 1940 1960 1980 Year 2000 2020 NASS • Theoretical maximum soybean yield = ??? bu/ac • Assumes maximum photosynthetic efficiency • Assumes minimum respiratory losses • Assumes perfect weather, no pest pressure….no yield-limiting factors de Wit 1967 • Theoretical maximum soybean yield = 335 bu/ac • Assumes maximum photosynthetic efficiency • Assumes minimum respiratory losses • Assumes perfect weather, no pest pressure….no yield-limiting factors de Wit 1967 • If trend for Ohio continues….we’ll see an 11.1 bu/ac yield increase by 2042. • Increase state average to ~56 bu/ac • If trend increases by 0.5 bu/ac per year….we’ll see a 26.1 bu/ac yield increase by 2042. • Increase state average to ~71.1 bu/ac • To reach a state average of 100 bu/ac by 2042…we’ll need an increase of 3.3 bu/ac per year. • Limitations to increasing soybean yield compared to corn: • Symbiotic relationship between soybean and rhizobia bacteria • Protein and oil = a lot of energy to produce • Soybean yield gains are occurring in Ohio. • Why? • Genetic improvement • Estimated 0.14 to 0.28 bu/ac per year yield increase • Agronomic improvement • Estimated 0.9 to 0.23 bu/acre per year Specht et al. 1999 • Soybean yield gains are occurring in Ohio. • Why? • Genetic improvement • Estimated 0.14 to 0.28 bu/ac per year yield increase • Agronomic improvement • Estimated 0.9 to 0.23 bu/acre per year Specht et al. 1999 • Genetic technology- Adopted by producers as soon as it becomes available • Agronomic technologies • Lengthy learning curves • Implementation requires capital expenditures (e.g., combine yield monitors, global positioning system software, etc) • Different every year/every location Specht et al. 1999 1. Determine which management practices lead to higher soybean quality traits and yield using a new type of experimental design called an “omission trial” 2. Determine yield-limiting factors through a statewide survey of soil quality, pests, and management practices using multivariate statistics 3. Inform and train Ohio soybean growers to identify yield-limiting factors on a field-by-field basis through soybean workshops and use of digital media. Determine which management practices lead to higher soybean quality traits and yield using a new type of experimental design called an “omission trial” • Study factors: These study factors have been • Rhizobia inoculant evaluated…. • Fungicide but not in a single, comprehensive • Insecticide study • Manganese foliar fertilizer • Omission trials • Relatively new type of experimental design and analysis • Overcome limitations of traditional statistical approaches • We will use omission trials to assist growers in evaluating the cost of agronomic practices against their yield increasing potential • Dr. Fred Below used omission trials to help determine which factors influence corn yield on his quest for 300 bushel corn. • Dr. Robert Mullen and graduate student used omission trials for Ohio corn production. • Some soybean omission trials have been conducted in other states • None have been conducted in Ohio • We propose conducting trials at nine locations in Ohio for two years • Limitations… • Cannot study interactions • No information about application timing or rate • Visual disease and insect ratings • Dr. Anne Dorrance, Dr. Andy Michel, and Dr. Ron Hammond • Plant tissue manganese • Chlorophyll, gas exchange, fluorescence • Pending funding from OARDC SEEDS grant • Soybean yield components • Protein and oil content • Inputs will be evaluated using large-plot research • Ohio Soybean Council has already funded 10 on-farms trials for 2013 • Trials will evaluate 1-3 treatments of omission trial Determine yield-limiting factors through a statewide survey of soil quality, pests, and management practices using multivariate statistics and principle component analysis . • We can use statistics to identify factors that are limiting yield in Ohio. • Similar procedure to Dr. Libby Dayton’s Phosphorus Risk Index study • • • • • Management practices (paper survey) Soil quality (sample collection) Plant nutrition (sample collection) Pest pressure (visual ratings and sample collection) Yield (from yield monitors) Management Practices • Crop rotation/cover crops • Tillage • Manure/fertilizer application • Drainage • Variety selection/seeding rate/row spacing • Etc…. Soil Quality • Texture, bulk density, compaction • Nutrients, pH, carbon • Organic matter Plant Nutrition Pests • Macronutrients • Micronutrients • • • • Potassium-deficient soybean, 2012 Soybean cyst nematode Diseases Insects Weeds • Collect samples from 60-70 soybean fields in 2013, 2014, and 2015 • Soybean fields will include: • Fields where OSU on-farm research is currently being conducted (Soybean Performance Trials, Extension research, Phosphorus Risk Index Study, etc.) • Fields as identified by Extension educators/field specialists • Volunteers at winter Extension meetings Appendix C: Protocol for plant tissue samples Plant tissue samples are to be collected at the R1 (flowering) growth stage. Samples will be analyzed for macro- and micronutrient concentration. • “Kits” will be given to cooperators (faculty, graduate students, Extension educators, field specialists, etc) Procedure for collecting plant tissue samples 1. Collect 10-15 plant samples from each area following a zigzag pattern (see diagram below). 2. Collect the uppermost fully developed trifoliate. Remove the petiole (see picture below). • Kits will contain sampling protocols and sampling materials • Kits will include postage and be mailed to Columbus for analysis 3. Place plant tissue samples into paper bags and label as “normal area 1,” “normal area 2,” or “low-yielding area.” 4. Mail all samples to Ohio State University, Columbus using the provided pre-paid mailing box. 10-15 fields in District 10, 20, 40, and 50 5-10 fields in District 30 and 70 2-6 fields in District 60, 80, and 90 % of Soybean Acres • A very robust dataset will be collected and analyzed with assistance from the Ohio State Statistical Consulting Service • What kind of information will be generated from this type of dataset?????????? Univariate Statistics Multivariate Statistics • Tests one factor at a time • Examines many factors • Traditional experimental design • More of a “systems” approach • What are the yield limiting factors for Ohio soybean fields? (By growing region) • How do yield limiting factors interact? • How does soil quality influence yield? • How does pest pressure influence yield? • How do management practices influence yield? • What are the yield limiting factors for Ohio soybean fields? (By growing region) • How do yield limiting factors interact? • How does soil quality influence yield? • How does pest pressure influence yield? • How do management practices influence yield? yield = soil nutrient * pH * bulk density * drainage * organic matter • Soil fertility/plant nutrition information will also generated • Identify emerging soil fertility/plant nutrition problems • Identify areas with a problem for further studies • Soil fertility/plant nutrition information will also generated • Identify emerging soil fertility/plant nutrition problems SULFUR SO2 Soil Solution SO4-2 SO4-2 Soil Organic Matter SO4-2 S0 S-2 SO2 Soil Solution SO4-2 SO4-2 Soil Organic Matter SO4-2 S0 S-2 • 60 bu/acre soybeans remove approximately 11 lb S/acre • 1994 atmospheric deposition ~ 7 lb S/acre • 2010 atmospheric deposition ~ 4 lb S/acre Atmospheric sulfur deposition is less than crop removal. Will sulfur applications be needed in the future? A STATE SURVEY OF PLANT TISSUE FOR MACRO- AND MICRONUTRIENTS WILL HELP IDENTIFY POTENTIAL PROBLEMS. Inform and train Ohio soybean growers to identify yield-limiting factors on a field-byfield basis through soybean workshops and use of digital media. Extend information to Ohio soybean growers Soybean Website Mobile Apps • Feature digital media library of pictures/videos • Possible apps: • FactSheets • Online decision making tools • Insect ID • Disease ID • Variety selection • Does inoculant, fungicide, insecticide, manganese foliar fertilizer, and nitrogen fertilizer increase soybean quality and yield? • What factors influence Ohio soybean production? • Publish results in a “yieldlimiting guide” • Criteria: • Soybean grower • Calibrated yield monitor and willing to share yield information • Willing to let us collect soil/plant samples (three times during growing season) • Willing to do an interview (~1 hr) • $200 compensation for farmers • Farmers also receive soil test and plant analysis info • District 10 (Williams, Fulton, Lucas, Defiance, Henry, Wood, Paulding, Putnam, Hancock, Van Wert, Allen) 10-13 • District 20 (Ottawa, Erie, Sandusky, Lorain, Seneca, Huron, Wyandot, Crawford, Richland, Ashland) 10-14 • District 30 (Ashtabula, Lake, Cuyahoga, Geauga, Trumbull, Portage, Summit, Medina, Wayne, Summit, Mahoning, Wayne, Stark, Columbiana) 5-10 • District 40 (Mercer, Auglaize, Hardin, Shelby, Logan, Darke, Miami, Champaign, Clark) 10-13 • District 50 (Marion, Morrow, Knox, Union, Delaware, Licking, Franklin, Madison, Fairfield, Pickaway, Fayette, Ross) 10-13 • District 60 (Holmes, Coshocton, Tuscarawas, Carroll, Harrison, Jefferson, Belmont) 2-6 • District 70 (Preble, Montgomery, Greene, Butler, Warren, Clinton, Hamilton, Clermont) 5-8 • District 80 (Highland, Pike, Jackson, Brown, Adams, Scioto, Lawrence, Gallia) 2-6 • District 90 (Muskingum, Guernsey, Noble, Monroe, Perry, Morgan, Washington, Hocking, Athens, Vinton, Meigs) 2-6 • Can pay mileage for Extension personnel • If willing to help collect soil/plant samples and yield info, we will provide protocols, sampling tools, and postage to mail samples to Columbus for analysis 1.) Prior to or just after planting- Soil sample for quality 2.) R1- Plant tissue sample/pest rating 3.) R3- Pest rating/SCN 4.) Harvest- Yield data/grain sample Thank you for your time!
