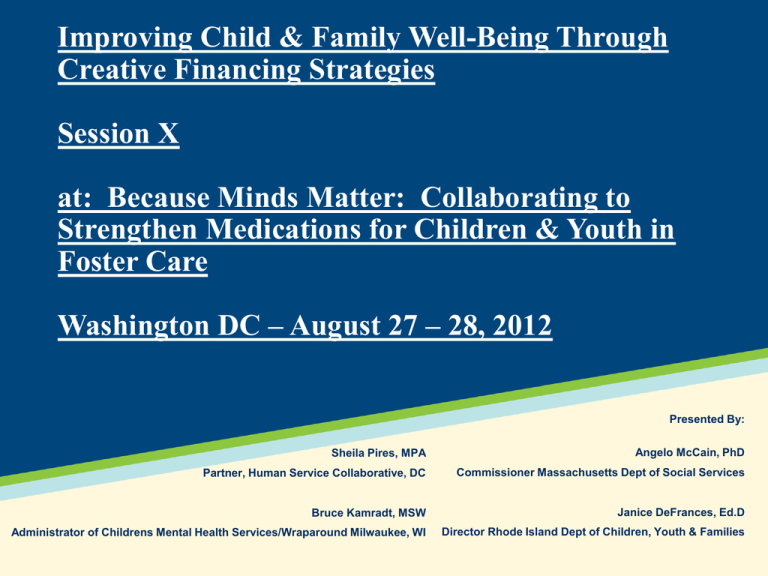
Improving Child & Family Well-Being Through
Creative Financing Strategies
Session X
at: Because Minds Matter: Collaborating to
Strengthen Medications for Children & Youth in
Foster Care
Washington DC – August 27 – 28, 2012
Presented By:
Sheila Pires, MPA
Angelo McCain, PhD
Partner, Human Service Collaborative, DC
Commissioner Massachusetts Dept of Social Services
Bruce Kamradt, MSW
Janice DeFrances, Ed.D
Administrator of Childrens Mental Health Services/Wraparound Milwaukee, WI
Director Rhode Island Dept of Children, Youth & Families
What is Wraparound Milwaukee
It is a unique “system of care” for children and
adolescents with serious emotional, behavioral and
mental health needs and their families designed to
achieve better child and family outcomes at less cost
Serves Milwaukee County – 1 million population
The program serves over 1,400 (950 avg daily
enrollment) families annually with a budget of $47
million per year
70% of youth served are under the jurisdiction of
Child Welfare or Juvenile Justice
What is Wraparound Milwaukee
– cont’d
Youth served are those with complex needs at
immediate risk of institutional care in residential
treatment facilities, psychiatric inpatient facilities or
juvenile correctional facilities
Our approach is based on a set of core values and
principles that put child and family well being at the
center of the service systems
Elements of Wraparound
Strengths
Community
Based
Unconditional
Care
System
Integration
Normalization
Values &
Principles
Family
Centered
Cultural
Competency
Refinancing
Collaboration
Needs
Driven
How is Wraparound Milwaukee
Structural & Organized
Publically operated Care Management Entity (CME) –
operated by Milwaukee County Behavioral Health Division to
care for SED youth regardless of the child serving system they
come from and are involved with
Integrated delivery of behavioral health and supportive services
across child serving systems for SED youth
Pooled funding across systems
Single payor of all care, including mental health, substance abuse,
supportive services and out-of-home care minus physical care
One care plan – one care coordinator
Extensive service array and provider network
Family directed – youth guided
How is Wraparound Milwaukee
Structural & Organized – cont’d
It is type of a behavioral health carve-out under a 1915(a)
contract between Milwaukee County Human Services and
State Dept. of Health but is more comprehensive because
it covers the delivery of services for children and families
beyond what Medicaid would normally cover
While it does not directly cover physical health care costs
it coordinates with the primary care physician particularly
around special health conditions and use of psychotropic
medication
Why was Wraparound Milwaukee
Created
Overutilization of institutional placements for children
in mid – 1990’s particularly residential treatment,
psychiatric hospitalization and juvenile correctional
placements
Poor outcomes of youth utilizing these out-of-home
placements
Overuse of high-cost institutional care was causing
financial problems for Milwaukee County and Medicaid
System needed better oversight, accountability and
more community-based alternatives
What are Components of Wraparound
Milwaukee Care Management Model
Using a Care Management Entity (CME) model, it
oversees care of all children with serious emotional
and mental health needs across child serving systems
Does fiscal management of system
Contracts with other child serving agencies ex.
Medicaid, Child Welfare, Juvenile Justice, etc.
Provides assessment/screening of youth eligible for
enrollment
Provides or contracts for care coordination services
(1:10 ratio)
What are Components of Wraparound
Milwaukee Model – cont’d
Operates 24/7 mobile crisis intervention services
Creates and manages a Provider Network of 200
agencies with 60 different services
Provides clinical and medical supervision of
behavioral health areas
Operates a single IT system and electronic health
record (minus physical health)
Conducts Quality Assurance/Quality Improvement
and Program Evaluation
Wraparound Milwaukee’s
Funding Model
Creates a funding pool through various funding arrangements
1.
2.
3.
Medicaid – actuarial determined capitated rate plus fee-for-service for crisis
services
Child Welfare – case rate agreement covering non-medicaid provided
services particularly out-of-home care costs
Delinquency Services – fixed annual funding based on 1995 expenditures
($8 million) plus a monthly case rate for diversions from juvenile
corrections
Principle approach is to re-direct money from institutional placement
expenditures to community-based care
Wraparound Milwaukee is the single payor for all services for enrolled
youth, is at risk for service costs and therefore has incentive to insure most
appropriate , cost effective care
Creating “win-win” Scenarios
Child Welfare
Medicaid
Alternative to out-of-home care
high costs/poor outcomes
Alternative to IP/ER-high cost
System of Care
Alternative to residential &
Correctional placements
Juvenile Justice
Alternative to day treatment costs
Special Education
How We Pool Funds
CHILD WELFARE
Funds thru Case Rate
(Budget for Institutional
Care for Chips Children)
10.0M
JUVENILE JUSTICE
(Funds Budgeted for
Residential Treatment and
Juvenile Corrections Placements)
10.0M
MEDICAID CAPITATION
MENTAL HEALTH
(2052per Month per Enrollee)
•CRISIS BILLING
•HTI GRANT
•HMO COMMERCIAL INSUR
20.0M
7.0 M
WRAPAROUND MILWAUKEE
CARE MANAGEMENT ORGANIZATION
(CMO)
47.0M
FAMILIES UNITED
$400,000
CHILD & FAMILY TEAM
OR
TRANSITION TEAM
PLAN OF CARE
OR
FUTURES PLAN
Advantages of Blended or
Pooled Funding Model
Flexibility
Adequacy of funding
De-Categorization of funds
Responsive to changing needs
Lends itself to positive manage care approach – don’t
need to “ration care”
De-Politicalizes allocation and awarding of funds
Outcomes for the System & Youth
Served in Wraparound Milwaukee
Outcomes currently being measured include programmatic,
fiscal, clinical, public safety, child permanency and consumer
satisfaction
Programmatically – the average daily residential treatment population has
dropped from 375 youth to 80 youth, inpatient psychiatric days from 5000
to under 500 days per year
Fiscally – the averages cost for a child/family in Wraparound is under $4000
per month versus over $10,000 per month for a residential treatment
placement, over $9000 per month for a correctional placement or well over
$10,000 for a 7-day hospital stay
Clinically – children function better at home, school and in the community
based on administration of nationally normed measures such as the CBCL
(Achenbach) used at the time of enrollment and discharge
Outcomes for the System & Youth Served
in Wraparound Milwaukee – cont’d
Public Safety – recidivism rates for delinquents are low (15.2%) for youth
in the program for at least one year and even lower (6.7%) for high risk
offenders including juvenile sex offenders (this is considerably under
national standards)
Child Permanence – 80% of youth achieve permanency, i.e., return to
parents, relatives, adoptive resources or subsidized guardianship upon
leaving Wraparound
Family Satisfaction – families surveyed upon completing Wraparound
(average 18 months) gave the program a rating of 4.4 out of 5 points in
terms of their perception of the progress their child made while in the
program
Cost of Doing Nothing
Residential Treatment Placements & Costs Without
Wraparound Milwaukee
Child Welfare/Juvenile Justice
Expenditures for RTC without
Wraparound Milwaukee
RTC Placements
63.4
8500
Potential Increase in RTC Placements w/o
Wraparound Milwaukee
RTC Rate Increase of 5%/year
7500
52.2
With 5% Increase of No. of Placements
47.4
(5% growth with NO Change in LOS)
650
7000
600
572
550
545
519
500
494
475
450
RTC Rate
630
600
43.0
38.9
6500
35.6
32.3
6000
29.2
5500
26.6
452
430
400
410
24.1
373
350
*
355
22.0
5000
*
391
4500
18.4
19.9
8389
7989
7609
7247
6902
6573
6260
5961
5678
5408
5151
4906
4673
4450
337
300
Average Daily Census of Youth In RTC’s
*Actual Number of Placements and Costs for That Year
Average RTC Rate and Total Projected
Annual Expenditures
20
09
20
08
20
07
20
06
20
05
20
04
20
03
20
02
20
01
20
00
19
99
19
98
19
97
19
96
4000
19
96
19
97
19
98
19
99
20
00
20
01
20
02
20
03
20
04
20
05
20
06
20
07
20
08
20
09
No. of Placements
57.5
8000

