Leman-Bhavana
advertisement
Structure, Tie Persistence and Event Detection
in Large Phone and SMS Networks
Leman Akoglu and Bhavana Dalvi
{lakoglu , bbd} @cs.cmu.edu
Carnegie Mellon University and iLab
Around 2M users,
50M edges,
500M phone
calls/SMS
6 months data
Structure Analysis
• If A calls/texts B n times, can we say anything about how many times
B calls/texts A?
• Are a node’s degree and its neighbors’ degrees correlated?
• How does the total duration or the number of phonecalls and SMSs
grow by the number of contacts a user has?
• Does tie strength of i and j depend on their neighborhood overlap?
Event Detection
TiePersistence
Persistence
Tie
Phone and SMS network
• Tie Persistence (TP) : It is the stability of ties across time as number of timeticks in which a link is observed, over the total number P of time-ticks.
• User Perseverance (UP) : Perseverance of a user is defined as the average
of the persistence of all his/her ties.
• At which points in time does the behavior of the customers
change considerably?
• Can the detected change-points be attributed to a set of
nodes, i.e. can we characterize which customer(s) cause
most of the change?
Methodology
• How to predict whether a link will persist in the future?
(1) Feature extraction:
• Characterize nodes
with 12 networkfeatures F: degree
(number of contacts),
total weight (phone
call duration), …
• One TxN time-series
matrix per feature,
T=183 days N=1,8M
users
• How are these attributes correlated to each other and to TP and UP ?
• Which link and node attributes are important in prediction?
Tie Attributes
Node Attributes
Reciprocity (R) :
1 if the tie is reciprocal in time tick
Topological Overlap (TO) :
Degree (K)
Cluster Coefficient (C) :
# triads in which node is
involved
# common
neighbours User reciprocity (r) : Faction of ties
Node degree containing both incoming and outgoing calls
Delta_C
Delta_K
Delta_r
R
TO
TP
Delta_C Delta_K
1
0.22
1
Link
attr
Delta_r
0.127
-0.13
1
R
-0.12
-0.4
0.08
1
TO
-0.07
-0.4
0.06
0.41
1
TP
-0.001
0.073
0.043
0.51
0.22
1
C
K
r
UP
C
K
r
UP
1
0.068
1
0.27
0.26
0.0679 0.07
1
0.39
1
(2) Event Detection:
• Define a sliding window of size W (set to 5 days)
• Generate a correlation matrix C, with Cij being Pearson’s correlation
between the time series of pair (i,j)over window W.
• Largest eigenvector of C give the “activity” of each node.
• Compare “activity” vectors over time by taking dot product score Z
(1 if same, 0 if perpendicular –flag for small Z)
Links
Node
attr
Logistic Regression
Model
• Link A-B
• Link & node
attr at time t
Prediction
• Logistic
Regression
Input
Tie strength based on (a) # SMS
Reciprocity
patterns can
be used to
spot outliers.
(b) # Phone calls
Deg of node
& avg deg of
its neighbors
exhibit
assortative
mixing
Total node
strength
grows superlinearly by
increasing
degree.
• Will link A-B
persist in time
t+k ?
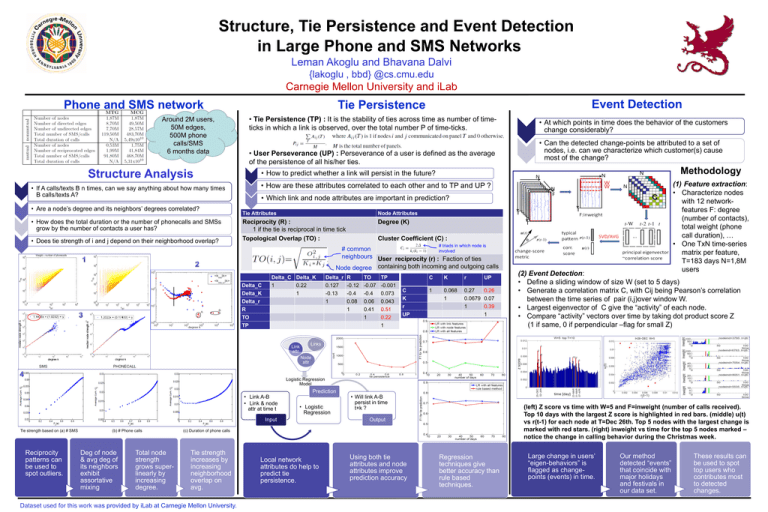
(left) Z score vs time with W=5 and F=inweight (number of calls received).
Top 10 days with the largest Z score is highlighted in red bars. (middle) u(t)
vs r(t-1) for each node at T=Dec 26th. Top 5 nodes with the largest change is
marked with red stars. (right) inweight vs time for the top 5 nodes marked –
notice the change in calling behavior during the Christmas week.
Output
(c) Duration of phone calls
Tie strength
increases by
increasing
neighborhood
overlap on
avg.
Dataset used for this work was provided by iLab at Carnegie Mellon University.
Local network
attributes do help to
predict tie
persistence.
Using both tie
attributes and node
attributes improve
prediction accuracy
Regression
techniques give
better accuracy than
rule based
techniques.
Large change in users’
“eigen-behaviors” is
flagged as changepoints (events) in time.
Our method
detected “events”
that coincide with
major holidays
and festivals in
our data set.
These results can
be used to spot
top users who
contributes most
to detected
changes.


