Atlantic vs. Pacific Oceans…What do you know?
advertisement
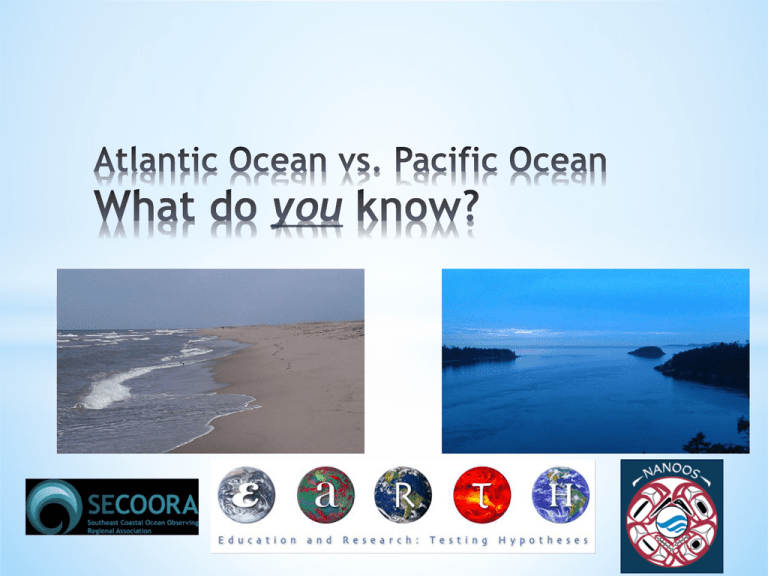
Atlantic Ocean Pacific Ocean Webquest-Follow instructions from my Sharepoint site! Explain 2-3 new things you learned from the webquest yesterday! Share briefly with your group before sharing with the class. REAL-TIME DATA Today! Yeah! Please copy TWO charts like the one below in your Science Notebook (Yes, use a ruler!): Buoy (Lat./Long.) Water Temp. °F Air Temp. °F Concerns? Real Time Data! Yeah! *1. Instructions for SECOORA: Go to this website: http://secoora.org/ * Click on “Data and Maps” * Click on “Explore Real-Time Data” * Start clicking on buoys and find your information! *2. Instructions for NANOOS: Go to this website: http://www.nanoos.org/ * Click on “NVS” (Nanoos Visualization System) on the left side. * “Click Here to View All Assets” *Click on “Assets.” Use the map OR the list on the left side to gather information. Fill in another chart like the one above for the Pacific Coast. **Keep in mind this is Real-Time Data (like from TODAY) and some buoys may not give all the data needed, or some may not work. Why do you think this could happen? Use as much information from each buoy as you can and get information from 15 buoys!* *5. Extra time today? Explore more data on the SECOORA or NANOOS sites. Find anything interesting? Write down your observations! Data Review and Excel Table/Graph! *Review data from yesterday. Go through SECOORA first from the east coast. Discuss observations. * Go through NANOOS from the west coast. Discuss observations. *Review with students how to make an Excel table and graph (see PowerPoint). The graphs will be bar graphs comparing the water temp and air temp from both coasts. *Questions? Head to the computer lab! Data Analysis * What do you notice about the temperature on each coast? Compare and contrast. Which one is cooler? Why? Which one is warmer? Why? * Where do the ocean currents from the Pacific originate? Explain how it affects the water temperature. * Where do the ocean currents from the Atlantic coast originate? Explain how it affects the water temperature. * Based on the water temperatures, how does this affect air temperature? Remember what we have studied! * What are the main differences (2-3) between these two oceans (from this data)? Explain in sentence form. * What are the main similarities (2-3) between these two oceans (from this data)? Explain in sentence form. * Explain 2-3 things you have learned from this data! Catch-Up! *Please finish all parts from this week (Webquest, Data Chart, Collection, Graph, and Data Analysis). *If you are completely finished, please read the two following articles. For each one, write down three (3) things you learned. Be sure to provide information about the ocean conveyor belt. *The Environmental Literacy Council-The Great Ocean Conveyor Belt http://www.enviroliteracy.org/article.php/545.html *Windows to the Universe-Transfer and Storage of Heat in the Oceans *http://www.windows2universe.org/earth/Water/ocea n_heat_storage_transfer.html Assessment! 1. Discussion of analysis questions! Listen for instructions! 2. Assessment: You will be constructing a Venn Diagram with both oceans. Requirements: AT LEAST five differences for the Pacific AT LEAST five differences for the Atlantic AT LEAST five similarities! 3. You may want to make a rough draft with words and sketches and then finish as a final draft. This is your assessment (test grade). Finally, you will also write 3-5 sentences at the bottom answering these two questions: a. Explain 2 things you learned about comparing and contrasting the Atlantic and Pacific Oceans. b. Explain what you can do to help our oceans! 4. Sharing time!
