Maps vs. Globes: Understanding Geographic Tools
advertisement
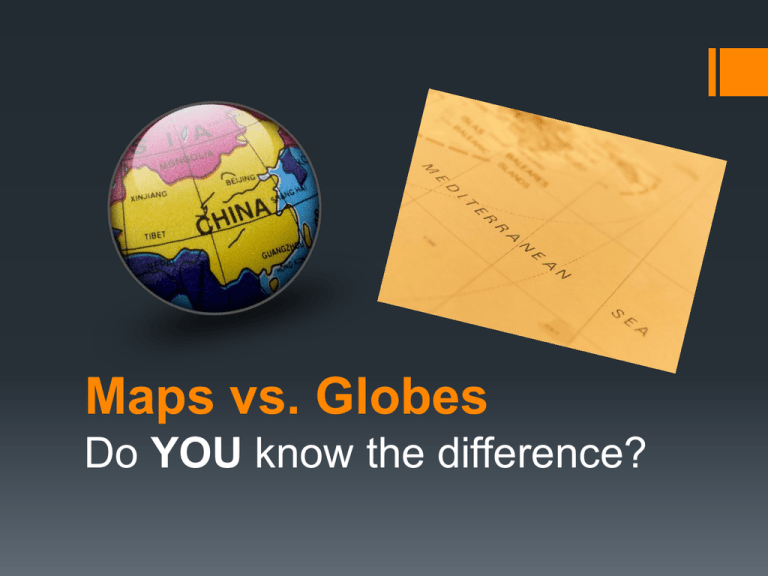
Maps vs. Globes Do YOU know the difference? • The tools that geographers use the most often are MAPS and GLOBES. • A map is FLAT drawing that shows all or part of the Earth’s surface. • A globe is a SPHERICAL, or ballshaped, model of the entire planet. Try it! Place the characteristics of maps and globes in the appropriate section of the Venn Diagram. There are THREE types of maps 1. POLITICAL MAPS: Show major political features of a region. Country Borders Capital Cities STAR symbol Use different colors to show countries There are THREE types of maps 2. PHYSICAL MAPS: Show major physical features of a region. Mountain ranges Rivers Oceans Islands Deserts Plains Shows different elevations There are THREE types of Maps 3. SPECIAL-PURPOSE MAPS: Focus on one special topic Topics can include: Climate, resources, or population Information may be shown with colors, arrows, dots or other symbols There are FOUR Hemispheres FIVE PARTS OF A MAP 1. TITLE: shows what the subject of the map is 2. COMPASS ROSE: indicates north, south, east and west 3. SCALE: represent distances between points on a map 4. LEGEND: or KEY explains what symbols represent 5. LOCATOR MAP: shows where in the world the area on the map is located Prime Meridian VS. Equator Prime Meridian: an imaginary line that runs North to South on the globe and represents ZERO degrees longitude. Equator: an imaginary line that circles the globe halfway between the North and South Poles and represents ZERO degrees latitude. Video – Using Maps & Globes http://app.discoveryeducation.com/player/view/assetGuid/DB C75ABD-4435-4CC4-AE36-1C662869F6BC
