Presentation (MS PowerPoint 765kB)
advertisement
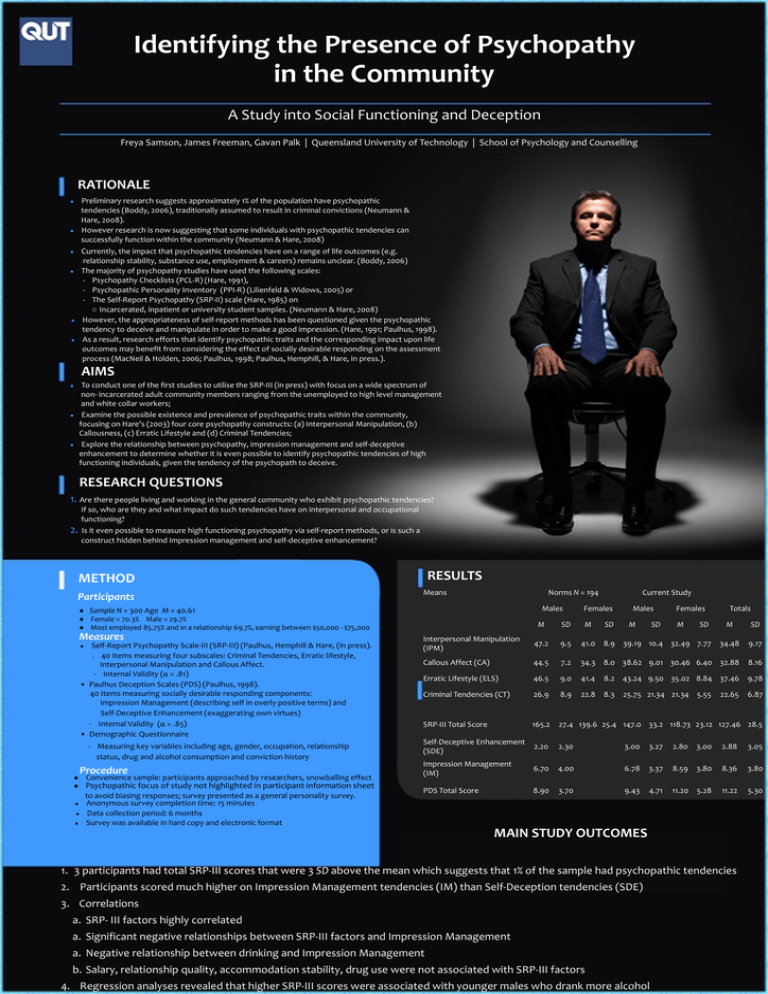
Identifying the Presence of Psychopathy in the Community A Study into Social Functioning and Deception Freya Samson, James Freeman, Gavan Palk | Queensland University of Technology | School of Psychology and Counselling RATIONALE Preliminary research suggests approximately 1% of the population have psychopathic tendencies (Boddy, 2006), traditionally assumed to result in criminal convictions (Neumann & Hare, 2008). However research is now suggesting that some individuals with psychopathic tendencies can successfully function within the community (Neumann & Hare, 2008) ● ● Currently, the impact that psychopathic tendencies have on a range of life outcomes (e.g. ● relationship stability, substance use, employment & careers) remains unclear. (Boddy, 2006) The majority of psychopathy studies have used the following scales: - Psychopathy Checklists (PCL-R) (Hare, 1991), - Psychopathic Personality Inventory (PPI-R) (Lilienfeld & Widows, 2005) or - The Self-Report Psychopathy (SRP-II) scale (Hare, 1985) on ○ Incarcerated, inpatient or university student samples. (Neumann & Hare, 2008) However, the appropriateness of self-report methods has been questioned given the psychopathic tendency to deceive and manipulate in order to make a good impression. (Hare, 1991; Paulhus, 1998). As a result, research efforts that identify psychopathic traits and the corresponding impact upon life outcomes may benefit from considering the effect of socially desirable responding on the assessment process (MacNeil & Holden, 2006; Paulhus, 1998; Paulhus, Hemphill, & Hare, in press.). ● ● ● AIMS To conduct one of the first studies to utilise the SRP-III (in press) with focus on a wide spectrum of non- incarcerated adult community members ranging from the unemployed to high level management and white collar workers; Examine the possible existence and prevalence of psychopathic traits within the community, focusing on Hare’s (2003) four core psychopathy constructs: (a) Interpersonal Manipulation, (b) Callousness, (c) Erratic Lifestyle and (d) Criminal Tendencies; Explore the relationship between psychopathy, impression management and self-deceptive enhancement to determine whether it is even possible to identify psychopathic tendencies of high functioning individuals, given the tendency of the psychopath to deceive. ● ● ● RESEARCH QUESTIONS 1. Are there people living and working in the general community who exhibit psychopathic tendencies? If so, who are they and what impact do such tendencies have on interpersonal and occupational functioning? Is it even possible to measure high functioning psychopathy via self-report methods, or is such a construct hidden behind impression management and self-deceptive enhancement? 2. RESULTS METHOD Participants Means Norms N = 194 Males ● Sample N = 300 Age M = 40.61 ● Female = 70.3% Male = 29.7% ● Most employed 85.75% and in a relationship 69.7%, earning between $50,000 - $75,000 Measures Self-Report Psychopathy Scale-III (SRP-III) (Paulhus, Hemphill & Hare, (in press). - 40 Items measuring four subscales: Criminal Tendencies, Erratic lifestyle, Interpersonal Manipulation and Callous Affect. - Internal Validity (α = .81) • Paulhus Deception Scales (PDS) (Paulhus, 1998). 40 - Items measuring socially desirable responding components: Impression Management (describing self in overly positive terms) and Self-Deceptive Enhancement (exaggerating own virtues) - Internal Validity (α = .85) • Demographic Questionnaire ● - Measuring key variables including age, gender, occupation, relationship status, drug and alcohol consumption and conviction history Procedure ● Convenience sample: participants approached by researchers, snowballing effect ● Psychopathic focus of study not highlighted in participant information sheet ● ● ● to avoid biasing responses; survey presented as a general personality survey. Anonymous survey completion time: 15 minutes Data collection period: 6 months Survey was available in hard copy and electronic format Current Study Females M SD Males M SD Females M SD M SD Interpersonal Manipulation (IPM) 47.2 9.5 41.0 8.9 39.19 10.4 32.49 7.77 Callous Affect (CA) 44.5 Erratic Lifestyle (ELS) Totals M SD 34.48 9.17 7.2 34.3 8.0 38.62 9.01 30.46 6.40 32.88 8.16 46.5 9.0 41.4 8.2 43.24 9.50 35.02 8.84 37.46 9.78 Criminal Tendencies (CT) 26.9 8.9 22.8 8.3 6.87 SRP-III Total Score 165.2 27.4 139.6 25.4 147.0 33.2 118.73 23.12 127.46 28.5 Self-Deceptive Enhancement (SDE) 2.20 2.30 3.00 3.27 2.80 3.00 2.88 3.05 Impression Management (IM) 6.70 4.00 6.78 3.37 8.59 3.80 8.36 3.80 PDS Total Score 8.90 3.70 9.43 4.71 11.20 5.28 11.22 5.30 25.75 21.34 21.34 5.55 22.65 MAIN STUDY OUTCOMES 1. 3 participants had total SRP-III scores that were 3 SD above the mean which suggests that 1% of the sample had psychopathic tendencies 2. Participants scored much higher on Impression Management tendencies (IM) than Self-Deception tendencies (SDE) 3. Correlations a. SRP- III factors highly correlated a. Significant negative relationships between SRP-III factors and Impression Management a. Negative relationship between drinking and Impression Management b. Salary, relationship quality, accommodation stability, drug use were not associated with SRP-III factors 4. Regression analyses revealed that higher SRP-III scores were associated with younger males who drank more alcohol


