Analyzing and Interpreting Data - NSTA Learning Center
advertisement
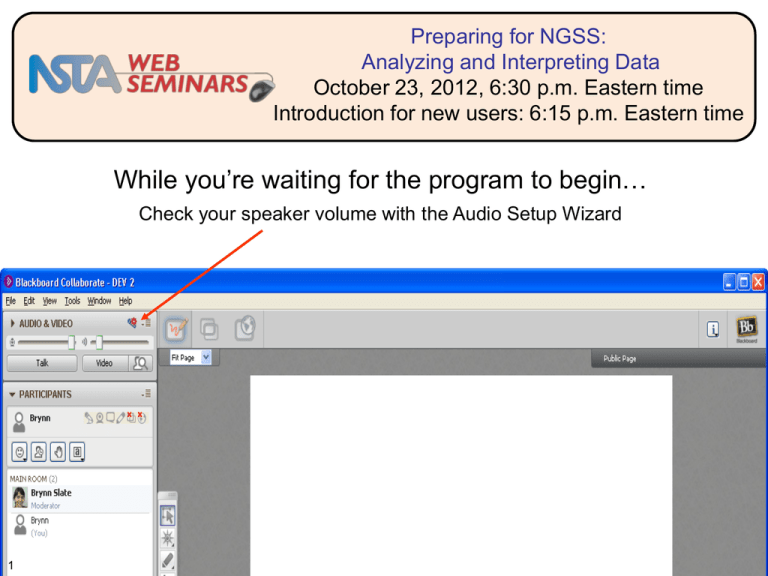
Preparing for NGSS: Analyzing and Interpreting Data October 23, 2012, 6:30 p.m. Eastern time Introduction for new users: 6:15 p.m. Eastern time While you’re waiting for the program to begin… Check your speaker volume with the Audio Setup Wizard 1 LIVE INTERACTIVE LEARNING @ YOUR DESKTOP Preparing for NGSS: Analyzing and Interpreting Data Presented by: Ann Rivet October 23, 2012 6:30 p.m. – 8:00 p.m. Eastern time 2 Agenda 1. Audio setup 2. Tech support 3. Interactive tools 4. NSTA Learning Center resources 5. Presentation 6. Evaluation 7. Informal Q&A 3 Tech Support Jeff Layman NSTA Technical Coordinator jlayman@nsta.org 703-312-9384 private chat message For additional tech help call Blackboard Collaborate Support 1-877-382-2293 NSTA staff also available to help: Brynn Slate Manager of NSTA Web Seminars 4 Ted Willard Director of NSTA’s efforts around NGSS Preferences • Turn off notifications of other participants arriving 1 5 Edit -> Preferences 2 General -> Visual notifications Using the Chat • During set breaks, the chat will be on • Continue discussion in community forums NSTA Learning Center, http://learningcenter.nsta.org/discuss/ • Minimize or detach and expand chat panel 6 Practice using the polling buttons 1 2 7 What is your role in education? A. Classroom teacher B. Principal or administrator C. University faculty D. Professional development coordinator or curriculum coordinator E. Other 8 LIVE INTERACTIVE LEARNING @ YOUR DESKTOP Preparing for NGSS: Analyzing and Interpreting Data Presented by: Ann Rivet October 23, 2012 6:30 p.m. – 8:00 p.m. Eastern time 9 NSTA Learning Center • 9,900+ resources – 3,400+ free! – Add to “My Library” to access later • Community forums • Online advisors to assist you • Tools to plan and document your learning • http://learningcenter.nsta.org 10 Developing the Standards 11 Developing the Standards Assessments Curricula Instruction Teacher Development July 2011 2011-2013 12 NGSS Development Process In addition to a number of reviews by state teams and critical stakeholders, the process includes two public reviews. 1st Public Draft was in May 2012 2nd Public Draft will take place in the Fall of 2012 Final Release is expected in the Spring of 2013 IT’S NOT OUT YET! 13 A Framework for K-12 Science Education 14 Released in July 2011 Developed by the National Research Council at the National Academies of Science Prepared by a committee of Scientists (including Nobel Laureates) and Science Educators Three-Dimensions: Scientific and Engineering Practices Crosscutting Concepts Disciplinary Core Ideas Free PDF available from The National Academies Press (www.nap.edu) Print Copies available from NSTA Press (www.nsta.org/store) Scientific and Engineering Practices 1. Asking questions (for science) and defining problems (for engineering) 2. Developing and using models 3. Planning and carrying out investigations 4. Analyzing and interpreting data 5. Using mathematics and computational thinking 6. Constructing explanations (for science) and designing solutions (for engineering) 7. Engaging in argument from evidence 8. Obtaining, evaluating, and communicating information 15 Crosscutting Concepts 1. Patterns 2. Cause and effect: Mechanism and explanation 3. Scale, proportion, and quantity 4. Systems and system models 5. Energy and matter: Flows, cycles, and conservation 6. Structure and function 7. Stability and change 16 Disciplinary Core Ideas Life Science Physical Science LS1: From Molecules to Organisms: Structures and Processes PS1: Matter and Its Interactions LS2: Ecosystems: Interactions, Energy, and Dynamics LS3: Heredity: Inheritance and Variation of Traits PS2: Motion and Stability: Forces and Interactions PS3: Energy PS4: Waves and Their Applications in Technologies for Information Transfer LS4: Biological Evolution: Unity and Diversity Earth & Space Science Engineering & Technology ESS1: Earth’s Place in the Universe ETS1: Engineering Design ESS2: Earth’s Systems ETS2: Links Among Engineering, Technology, Science, and Society ESS3: Earth and Human Activity 17 Closer Look at a Performance Expectation Construct and use models to explain that atoms combine to form new substances of varying complexity in terms of the number of atoms and repeating subunits. [Clarification Statement: Examples of atoms combining can include Hydrogen (H2) and Oxygen (O2) combining to form hydrogen peroxide (H2O2) or water(H2O). [Assessment Boundary: Restricted to macroscopic interactions.] Performance expectations combine practices, core ideas, and crosscutting concepts into a single statement. 18 Closer Look at a Performance Expectation Construct and use models to explain that atoms combine to form new substances of varying complexity in terms of the number of atoms and repeating subunits. [Clarification Statement: Examples of atoms combining can include Hydrogen (H2) and Oxygen (O2) combining to form hydrogen peroxide (H2O2) or water(H2O). [Assessment Boundary: Restricted to macroscopic interactions.] Performance expectations combine practices, core ideas, and crosscutting concepts into a single statement. 19 Practices and the NGSS: Analyzing and Interpreting Data Ann Rivet Teachers College Columbia University NSTA Webinar October 23, 2012 20 Who Am I? • Associate Professor of Science Education at Teachers College Columbia University • Background in science: physics and earth science • Focus on the design of learning environments that support students in understanding the Earth • Connections between curriculum, instruction, and assessment 21 Who Am I? • Associate Professor of Science Education at Teachers College Columbia University • Background in science: physics and earth science • Focus on the design of learning environments that support students in understanding the Earth • Connections between curriculum, instruction and assessment Caveats • Not part of the Framework development team • Not an expert in engineering 22 Overview • What is the practice of analyzing and interpreting data? • Why is analyzing and interpreting data important? • Connections within the Framework • Progression of practice • Classroom examples • Discussion 23 Poll: What is Data? • Which of the following do you NOT consider to be data? A. Photos B. Drawings C. Written Observations D. Measurements E. 24 All of the above can be data What Does “Analyzing and Interpreting Data” Mean? • Data: Facts, statistics, or items of information • Analyze: To study or determine the nature and relationship of the parts • Interpret: To explain the meaning of 25 What Does “Analyzing and Interpreting Data” Mean? • Data: Facts, statistics, or items of information • Analyze: To study or determine the nature and relationship of the parts • Interpret: To explain the meaning of • The process of assigning meaning to collected information and determining conclusions, significance, and implications • A function of both the type of information and the question asked 26 The Practice of Analyzing and Interpreting Data • Practices: Ways of thinking about and working with science concepts to address problems and answer questions • The goal in science is to connect information (in the form of data) to some sort of claim or explanation • In the process of doing so, the information needs to be put in a form where the meaning of the data can be recognized and extracted. • This is the practice of analysis and interpretation • Guiding questions: “What do the data we collected mean?” “How do these data help me answer my question?” 27 Why Focus on Analyzing and Interpreting Data? • Key piece of both the “doing” and “thinking” of science that is often overlooked or skimmed over • Central to connecting abstract ideas and concrete examples • Uses multiple tools and strategies • Engages a wide array of thinking and reasoning skills • In engineering, iterative cycles are not just trial and error. They are about figuring out HOW it worked in a particular way and WHY. 28 Practices and the Framework 1. Ask questions and defining problems 2. Developing and using models 3. Planning and carrying out investigations 4. Analyzing and interpreting data 29 5. Using mathematics and computational thinking 6. Developing explanations and designing solutions 7. Engaging in argument from evidence 8. Obtaining, evaluating, and communicating information How Relates to Other Practices • Analyzing and interpreting data is the process of connecting information gathered in investigations to explanations, models and arguments through the transformation of data into evidence. • Obtaining evidence is the central purpose underlying data analysis and interpretation • Connected to all the other practices 30 Guided by Questions and Investigations 1. Ask questions and defining problems 2. Developing and using models 3. Planning and carrying out investigations 4. Analyzing and interpreting data 31 5. Using mathematics and computational thinking 6. Developing explanations and designing solutions 7. Engaging in argument from evidence 8. Obtaining, evaluating, and communicating information Informed By Models 1. Ask questions and defining problems 2. Developing and using models 3. Planning and carrying out investigations 4. Analyzing and interpreting data 32 5. Using mathematics and computational thinking 6. Developing explanations and designing solutions 7. Engaging in argument from evidence 8. Obtaining, evaluating, and communicating information Uses Mathematics Tools 1. Ask questions and defining problems 2. Developing and using models 3. Planning and carrying out investigations 4. Analyzing and interpreting data 33 5. Using mathematics and computational thinking 6. Developing explanations and designing solutions 7. Engaging in argument from evidence 8. Obtaining, evaluating, and communicating information Informs Explanations, Arguments, and Communication 1. Ask questions and defining problems 2. Developing and using models 3. Planning and carrying out investigations 4. Analyzing and interpreting data 34 5. Using mathematics and computational thinking 6. Developing explanations and designing solutions 7. Engaging in argument from evidence 8. Obtaining, evaluating, and communicating information A Central Practice! 1. Ask questions and defining problems 2. Developing and using models 3. Planning and carrying out investigations 4. Analyzing and interpreting data 35 5. Using mathematics and computational thinking 6. Developing explanations and designing solutions 7. Engaging in argument from evidence 8. Obtaining, evaluating, and communicating information Questions? Submit your questions and ideas via the chat. REMINDERS • To turn off notifications of other participants arriving go to: Edit -> Preferences -> General -> Visual notifications • You can minimize OR detach and expand chat panel • Continue the discussion in the Community Forums http://learningcenter.nsta.org/discuss 36 Tools for Analysis • Tables • Permit major features of data to be summarized in accessible form • Graphs • Visually summarize the data • Mathematics • Expressing relationships between different variables in the dataset • Computer-based “visualization” tools • Allow data to be displayed in a variety of forms • Standard statistical techniques • Help to reduce the effect of error 37 What Scientists Look For in Data • Patterns • Significant features • Relationships • Trends • Anomalies 38 Poll: How Much Do Students Work With Data? • How often do students work with data in your classroom? A. At least once a week B. Once a month or so C. Several times a year D. A few times a year E. 39 Never Progression Across Grades • Increased sophistication and fluency of the practice of analyzing and interpreting data, and the relationship to other practices, as students move through k-12 science 40 Analyze and Interpret Data: Grades K-2 • Focus on collecting, recording, and sharing observations 41 Analyze and Interpret Data: Grades K-2 • Focus on collecting, recording, and sharing observations • Share observations 42 Analyze and Interpret Data: Grades K-2 • Focus on collecting, recording, and sharing observations • Share observations • Make measurements 43 Analyze and Interpret Data: Grades K-2 • Focus on collecting, recording, and sharing observations • Share observations • Make measurements • Note patterns and relationships 44 Analyze and Interpret Data: Grades K-2 • Focus on collecting, recording, and sharing observations • Share observations • Make measurements • Note patterns and relationships 45 Analyze and Interpret Data: Grades 3-5 • Emphasize more quantitative approaches, and multiple trials of qualitative data • Display data in tables and graphs • Compare data across different groups • Evaluate claims of cause and effect 46 Example: Investigating Advantage of Machines • Question: How can machines move things that I can’t? Lesson Sequence 1. Incline plane – each group takes one measurement of force and distance for each set-up (one trial). Group measurements are pooled into one class data table. Class discussion of consistency and identification of outliers. Teacher models how to average the data, and how to create comparative bar graphs. Through discussion, class generates interpretations of the analysis by developing initial “class rule” for the relationship. ? 47 ? Example: Investigating Advantage of Machines 2. Lever – Each group conducts one trial of each set-up, gathering both force and distance data. The data from each group is again compiled into class data tables, with a second conversation about consistency and identification of outliers. However, then groups work individually to average and graph the data. These are shared and compared, and the class writes interpretations. They revise their initial “class rule” of the relationship. ? ? 48 Example: Investigating Advantage of Machines 3. Pulley – Groups now conduct three trials of each set-up and average their own data. Groups then create comparative bar graphs of both force and distance that include data from the three different configurations. The graphs are compared and discussed. Student groups write their own interpretations of the graphs. The class as a whole revises the “class rule” to include the importance of changing the direction of applied force. ? 49 Force (N) ? ? Force Distance (m) Distance Without Pulley With Fixed Pulley With Free Pulley Without Pulley With Fixed Pulley With Free Pulley Analyze and Interpret Data: Grades 6-8 • Increased quantitative analyses in investigation, distinguishing causation vs. correlation, basic statistical techniques • Use mean, median, mode and variability to describe data • Identify linear and non-linear relationships using graphs • Consider limitations (e.g., measurement error) and ways to increase precision (e.g., multiple trials) • Use graphical displays of large data sets to analyze temporal and spatial relationships 50 Example: Investigating Motion • Question: Why do I need to wear a helmet when I ride my bike? • Concepts: Relationships between mass, velocity, acceleration, force 51 Distance-Time Graphs • Moving away, fast and slow 52 • Moving toward, fast and slow Velocity-Time Graphs • Accelerating down the ramp, higher and higher 53 • Investigating acceleration as mass is increased Example: Investigating Earth Systems Question: Where is all the water? 54 Example: Investigating Earth Systems Amount of precipitation 55 Mean population density Description of locations All values 31.6 - Greater than 300 cm/year 47.4 Near the Equator – Indonesia, West Africa, Brazil, and Central America Less than 10 cm/yr 9.6 Sahara Desert in Africa, Andes Mountains in South America, Himalaya Mountains in Asia Question: Where is all the water? • Usefulness of the tool for looking at patterns of data across the Earth Analyze and Interpret Data: Grades 9-12 • More detailed statistical analyses and use of computational models to generate and analyze data 56 • Use tools such as computational or mathematical models to generate and analyze data for scientific claims or optimal design solutions • Consider limitations to analysis (e.g., sample size, measurement error) • Determine function fits to data (slope, intercept, and correlation coefficient) • Triangulation across types of data sets to examine consistency of measurement and observation Example: Water Quality Investigation • Visual images and water quality tests (pH, DO, turbidity) • Analyze through tables, graphs, and comparison of images and archival data • Triangulate interpretations across multiple data sources 57 Computational Models EdGCM Educational Global Climate Model 58 Computational Models EdGCM Educational Global Climate Model 59 Example: Engineering Energy Efficiency 60 • Question: How do we design an efficient solar house? • Design and test model houses to improve energy efficiency, using sensors, CAD tools, and infrared imaging probes • Power, energy, heat transfer, thermal equilibrium, specific heat, conduction, convection, radiation, heat capacity, solar energy… Questions? Submit your questions and ideas via the chat. REMINDERS • To turn off notifications of other participants arriving go to: Edit -> Preferences -> General -> Visual notifications • You can minimize OR detach and expand chat panel • Continue the discussion in the Community Forums http://learningcenter.nsta.org/discuss 61 Common Challenges • Under-analyzing the data • Connect claim to question irrespective of the data • Over-analyzing the data • One data point does not make a claim • Awareness and accountability of errors • Precision of measurement • Selection of appropriate tool(s) and procedure(s) • Usually more than one analysis needed to address the question 62 Assessment Goal: Awareness of relationship between data, questions, analysis tools, and concepts • Ask students to explain their process • How did they get to that interpretation? • Ask students to provide a rationale for the analysis tool and approach they used • Why did you choose to use that kind of graph? • Why did you average? • What other ways could you have looked at it? Why did you select this way? • Ask students about other considerations during analysis • What could be sources of error in your investigation? • How confident are you in these findings? What things make you unsure? 63 Conclusion • Kids MUST work with data! • The focus is on the connection between the question, data, and claim • Statistics, graphs, and other mathematics are TOOLS for analyzing and interpreting data, NOT the goal • The practice is complex and must build over multiple supported experiences across years • Lots of potential applications across the science curriculum 64 Thank You! Contact information: Professor Ann Rivet Program in Science Education Teachers College, Columbia University rivet@tc.columbia.edu 65 Questions? Submit your questions and ideas via the chat. REMINDERS • To turn off notifications of other participants arriving go to: Edit -> Preferences -> General -> Visual notifications • You can minimize OR detach and expand chat panel • Continue the discussion in the Community Forums http://learningcenter.nsta.org/discuss 66 NSTA Website (nsta.org/ngss) 67 Upcoming Web Seminars on Practices Date Topic Speaker 1 9/11 Asking Questions and Defining Problems Brian Reiser 2 9/25 Developing and Using Models Christina Schwarz and CindyPassmore 3 10/9 Planning and Carrying Out Investigations Rick Duschl 4 10/23 Analyzing and Interpreting Data Ann Rivet 5 11/6 Using Mathematics and Computational Thinking Robert Mayes and Bryan Shader 6 11/20 Constructing Explanations and Designing Solutions Katherine McNeill and Leema Berland 7 12/4 Engaging in Argument from Evidence Joe Krajcik 8 12/18 Obtaining, Evaluating and Communicating Information Philip Bell, Leah Bricker, and Katie Van Horne All take place on Tuesdays from 6:30-8:00 pm ET 68 Next Web Seminar November 6 (two weeks from today) Using Mathematics and Computational Thinking Teachers will learn more about: the importance of mathematics and computation as fundamental tools for representing physical variables and their relationships; how tools are used for a range of tasks, including constructing simulations; statistically analyzing data; and recognizing, expressing, and applying quantitative relationships; mathematical and computational approaches that enable Presenters: scientists and engineers to predict the behavior of Robert Mayes & systems and test the validity of such predictions Bryan Shader 69 Graduate Credit Available Shippensburg University will offer one (1) graduate credit to individuals who attend or view all eight webinars. Participants must either: Attend the live presentation, complete the survey at the end of the webinar, and obtain the certificate of participation from NSTA, or View the archived recording and complete the reflection question for that particular webinar. In addition, all participants must complete a 500 word reflection essay. The total cost is $165. For information on the course requirements, as well as registration and payment information visit www.ship.edu/extended/NSTA 70 Community Forums 71 NSTA Area Conferences These conferences will include a number of sessions about the K–12 Framework and the highly anticipated Next Generation Science Standards. Among the sessions will be an NSTA sponsored session focusing on the Scientific and Engineering Practices. 72 NSTA Print Resources NSTA Reader’s Guide to the Framework 73 NSTA Journal Articles about the Framework and the Standards Thank you to the sponsor of tonight’s web seminar: This web seminar contains information about programs, products, and services offered by third parties, as well as links to third-party websites. The presence of a listing or such information does not constitute an endorsement by NSTA of a particular company or organization, or its programs, products, or services. 74 National Science Teachers Association Gerry Wheeler, Interim Executive Director Zipporah Miller, Associate Executive Director, Conferences and Programs Al Byers , Ph.D., Assistant Executive Director, e-Learning and Government Partnerships Flavio Mendez, Senior Director, NSTA Learning Center NSTA Web Seminars Brynn Slate, Manager Jeff Layman, Technical Coordinator 75 Upcoming Programs Pythagorean Theorem: Exploring Space Through Math--Lunar Rover October 24, 2012 The NSTA Learning Center: Free Professional Learning Resources for Educators October 25, 2012 Meteorology: How Clouds Form October 25, 2012 Register at http://learningcenter.nsta.org/webseminars 76 Program Evaluation • Click on the URL in the chat window • Take as long as you need • In exchange for completing the evaluation, you will receive: – A certificate of attendance – NSTA SciGuide ($6 value) – Please allow two weeks for your materials to arrive in your Learning Center library 77
