MBM6
advertisement
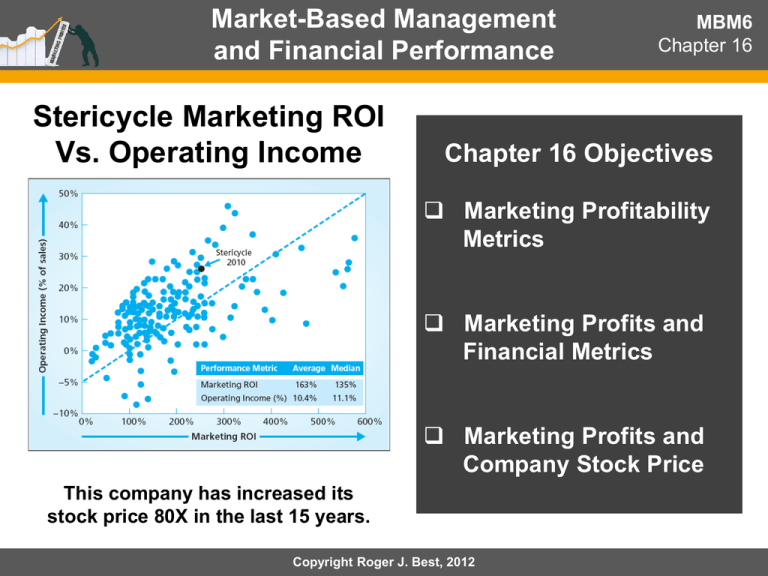
Market-Based Management and Financial Performance Stericycle Marketing ROI Vs. Operating Income MBM6 Chapter 16 Chapter 16 Objectives Marketing Profitability Metrics Marketing Profits and Financial Metrics Marketing Profits and Company Stock Price This company has increased its stock price 80X in the last 15 years. Copyright Roger J. Best, 2012 Market-Based Management and Financial Performance Marketing Profitability & Financial Performance This section focuses on the ways in which marketing profits contribute to financial performance. Copyright Roger J. Best, 2012 MBM6 Chapter 16 Net Marketing Contribution vs. Operating Income Stericycle MBM6 Chapter 16 Apple 2011 In 2011 Stericycle net marketing contribution was $568 million and operating income was $424 million. Copyright Roger J. Best, 2012 (Not in the 6th ed. text) GM Net Marketing Contribution vs. Operating Income MBM6 Chapter 16 Why is the GM Net Marketing Contribution less correlated with Operating Income? How well did Marketing ROI correspond with Operating Income as a percent of sales? Copyright Roger J. Best, 2012 Marketing Profitability Metrics MBM6 Chapter 16 There are three ways marketing and product managers can demonstrate and communicate marketing profits in financial terms. Copyright Roger J. Best, 2012 Marketing Model of Marketing Profitability Metrics Marketing Performance Tool 16.1 This model of marketing profits includes many of the factors that drive marketing profitability, Market Demand Market Share Revenue per Cost Cost per Customer Percent Margin Marketing Expenses Sales Expenses Copyright Roger J. Best, 2012 How Marketing Contributes to Sales Growth MBM6 Chapter 16 Stericycle (SRCL) above average rate of sales growth is driven by: A medical waste disposal market that is growing at 6.3% per year Increasing market share and number customers served worldwide A steady increase in Revenue per Customer Copyright Roger J. Best, 2012 Why Businesses with Higher Customer Satisfaction Are More Profitable MBM6 Chapter 16 Customer Satisfaction Index 82 and 25% “Very Satisfied” Higher levels of customer satisfaction contributes to: Customer Satisfaction Index 73 and 15% “Very Satisfied” • Higher average rev. per customer. • Higher percent margins. • Higher gross profit per customer. Copyright Roger J. Best, 2012 Company Customer Satisfaction and Stock Price MBM6 Chapter 16 ACSI – America Customer Satisfaction Index (www.theACSI.com) Companies with Higher Customer Satisfaction scores produce high rates of stock appreciation that companies with low levels. Copyright Roger J. Best, 2012 Why Customer Retention Corresponds to Profitability MBM6 Chapter 16 Lifetime Customer Value (Using 20% Discount Rate) $950 Annual Net Cash Flow …….. 1 2 3 4 5 6 7 8 9 10 Customer Life (years) $2500 Acquisition Cost The rate of return on the customer cash flow exponentially with customer retention. Why? Copyright Roger J. Best, 2012 20 (Not in the 6th ed. text) How Market-Based Management Impacts Assets & Return on Assets MBM6 Chapter 16 How do marketing strategies impact accounts receivable and inventory? Why is a high sale-to-asset ratio good? Copyright Roger J. Best, 2012 Marketing Profitability Metrics and Financial Metrics How would the financial metrics shown change if the net marketing contribution decreased by 10%? Copyright Roger J. Best, 2012 MBM6 Chapter 16 Financial Forecast That Includes Net Marketing Contribution Copyright Roger J. Best, 2012 MBM6 Chapter 16 Forecasting Stericycle Stock Price MBM6 Chapter 16 Stericycle has outperformed Dow Jones Waste & Disposal companies and S&P 500 average from 2005 to 2010. Copyright Roger J. Best, 2012 Market-Based Management and Financial Performance MBM6 Chapter 16 Market-Based Management and a strong Customer Focus is how marketing, sales and product managers contribute to above average performance. Copyright Roger J. Best, 2012 Add: 財務績效與顧客留住率 80%顧客留住率 90%顧客留住率 提高客戶價值亦提高股東價值 16-17
