- Cesar Observatory
advertisement
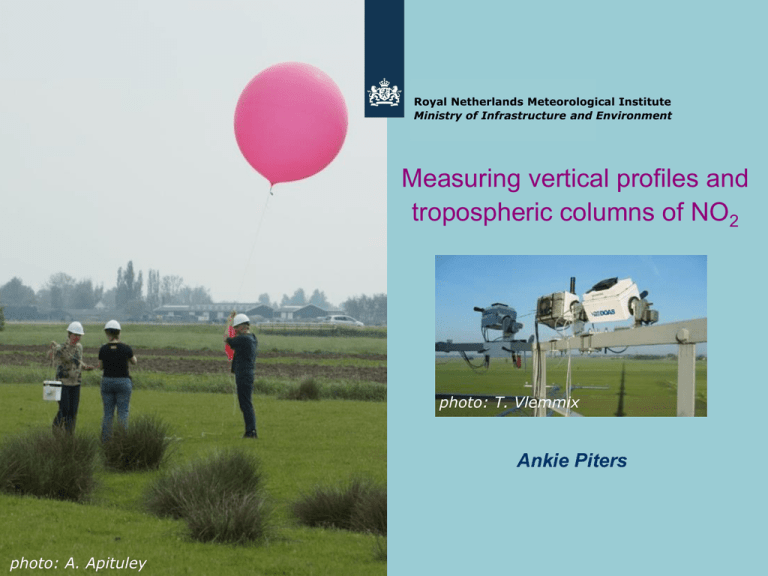
Royal Netherlands Meteorological Institute Ministry of Infrastructure and Environment Measuring vertical profiles and tropospheric columns of NO2 photo: T. Vlemmix Ankie Piters photo: A. Apituley Atmospheric Composition Research Main Scientific Themes: ozone layer, air quality, and chemistry-climate interaction Division: 76 people (of which ~40 on OMI/TROPOMI - PI) Observation group: Satellite observations: retrieval, validation and distribution of data. OMI, TROPOMI/S5p, GOME, SCIAMACHY, GOME-2, SEVIRI. Main products: O3, NO2, aerosols, clouds Ground-based measurements important for satellite and model validation Modelling group: Coupling TM5 to EC Earth , focus: aerosols and non-CO2 GHG Air quality forecasts Data assimilation Ground-based measurements of O3 and NO2 operational measurements ozonesondes in De Bilt since 1992 ozonesondes in Paramaribo (Surinam) since 1999 Brewer (O3 column) in De Bilt and Paramaribo (1994/1999) 2 MAX-DOAS (trop NO2) in De Bilt/Cabauw (2008) participation in global networks: GAW/WOUDC, SHADOZ, NDACC instrument development: NO2 sonde development since 2008 campaigns in Cabauw (focus NO2) DANDELIONS 2005 & 2006 CINDI 2009 PEGASOS, 2012 other campaigns (with NO2 sonde) DISCOVER-AQ, Washington/Baltimore, 2011 ACTRIS, Hohenpeissenberg, 2012 DISCOVER-AQ, California, Jan-Feb 2013 VOGA-NCP, Beijing area, June 2013 MAX-DOAS NO2 sonde preparation side-by-side intercomparison: 4 sondes + 2 NOx analysers Cabauw – increasing satellite validation potential (chemistry) Cabauw: • Tropospheric air representative for satellite pixel sizes • Wide range of pollution levels, no local sources nearby (except for farms!) • Vertical information (tropospheric columns) with remote sensing instruments, global NO2 distribution based on OMI data complemented with in-situ on site and in tower. picture: Ronald van der A, KNMI Gases of interest: • O3, NO2, CO2, AOD, CO, CH4, HCHO, H2O and SO2 Long-term goals • Organise campaigns for satellite validation • Maintain current operational NO2 measurements • Increase potential of Cabauw with an FTS instrument measuring vertical columns and profiles of GHG (together with ECN) FTIR visit in Cabauw Mobile FTIR from BIRA Columns and profiles of CH4, CO, and N2O between May and July 2013 (PEGASOS and INGOS) CH4 CO N2O MAX-DOAS • spectrum of scattered sunlight at different elevation angles • tropospheric NO2 from differential absorption w.r.t. zenith (strat. NO2) Wittrock et al., in prep., AMT Cabauw Intercomparison campaign for Nitrogen Dioxide measuring Instruments overview: Piters et al, AMT, 2012 Photo: M. Kroon MAX-DOAS tropospheric NO2 compared to OMI Vlemmix et al, AMT, 2010 When aerosol correction applied: no sign. bias between OMI and MAXDOAS σGB< 30% : R=0.64 (grey) σGB< 20% : R=0.73 (black) σGB< 10% : R=0.88 (red) Spread larger than expected from retrieval errors alone. Difference in spatial representativity Use of MAX-DOAS data in model verification National Air Quality Model Lotos-Euros measurements from De Bilt Average trop NO2 for different wind directions (5.1015 molec cm-2 per circle) Vlemmix et al., ACPD 2012 Sunday The NO2 sonde - Measures high resolution NO2 profiles Light weight Low power consumption Can be launched on small weather balloon Idea: Wesley Sluis Chemistry: Mirjam den Hoed Design: Marc Allaart The NO2 profiles up to ~10km (balloon burst) two profiles for each launch (‘up’ and ‘down’) large variability in shapes Winter 2010-2011 sonde on tethered balloon: - build up of boundary layer - development of detailed structures Measurement principle based on chemiluminescent reaction of NO2 with luminol photons are detected with photodiode array electronics: converts femto-amperes to millivolts luminol reservoir prevents acidification by CO2 Sluis et al., AMT, 2010 How accurate can we measure NO2? NO2 variations are very well captured. RMS difference is <10% absolute calibration still to be optimized (here: constant scaling factors applied) Demonstration for OMI NO2 validation Red: a priori (model) profile used for satellite retrievals Black: NO2 sonde profile 21 May 2012 error: ~5% 22 May 2012 error: ~50% Difference in profile shape results in errors up to 50% in satellite NO2 Piters et al., ACVE, 2013 Comparing with AQ models Thanks to: Henk Eskes and Patricia Castellanos, KNMI Modeled NO2 above boundary layer 1km, start of back-trajectory BL (model) The Lotos-Euros model shows: NO2 vertical transport to the free troposphere Horizontal transport of free tropospheric NO2 Possible origin of difference with sonde: Life time of NO2 Vertical/horizontal transport Surface emissions 24h backtrajectory at 1km height = measured air mass PEGASOS campaign May 2012, Cabauw (only NO2 instruments are shown) NOx analyser @200m RIVM MAX-DOAS (2x) Weather balloon zeppelin mobile lab (Juelich) NOx analysers RIVM/LML Marc and Ankie with NO2 sondes NO2 lidar RIVM Photo: A. Apituley 1200 m EURAD model (Univ. Cologne) 500 m 0m 27-5-2012 6:00 7:00 8:30 9:45 NO2 concentration (arbitrary offset and scaling) Future plans ... Marc and Deborah recovering a sonde • Optimisation of the calibration • Optimisation of the design • Transfer knowledge to industry for serial production • Use it for the validation of models, MAXDOAS and indirectly of satellites Photo: A. Apituley
