3(02)_dehaij
advertisement
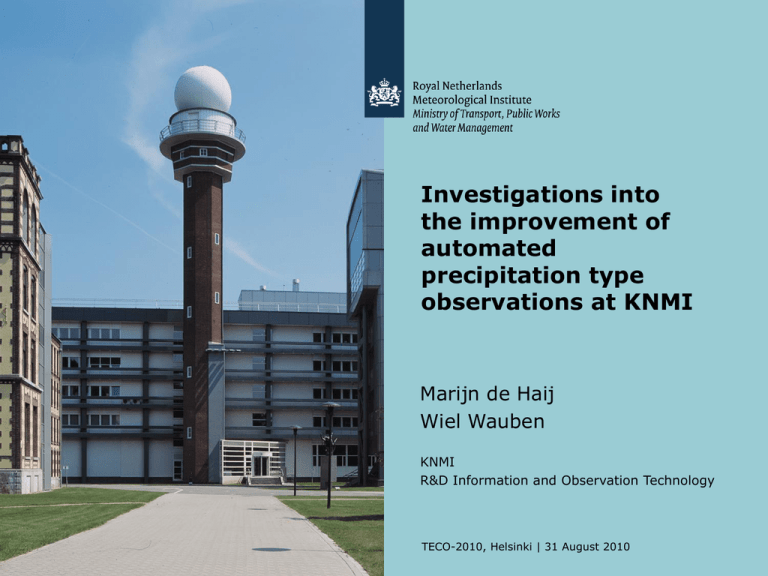
Investigations into the improvement of automated precipitation type observations at KNMI Marijn de Haij Wiel Wauben KNMI R&D Information and Observation Technology TECO-2010, Helsinki | 31 August 2010 Contents • The main issues • Investigation of new sensors • Conclusions and outlook TECO-2010, Helsinki | 31 August 2010 TECO-2010, Helsinki | 31 August 2010 3 Precipitation type observation Visual observations in SYNOP/METAR issued by KNMI fully automated using Vaisala FD12P scatterometers, with exception of 2 airports Combines optical (~size) and DRD12 detector (~water content) signals Differences with human observer analyzed and reported to users (e.g. Wauben, 2002) Most important issues: - Discrimination of mixed/solid precipitation - Classification of light precipitation events - Detection of hail - Precipitation detection in fog (MOR<400m) FD12P De Bilt Test TECO-2010, Helsinki | 31 August 2010 4 Comparison with human observer Overlapping hourly observations at 6 KNMI stations in 2000-2002 Correction rules and averaging applied on 1-min sensor data Precipitation FD12P Obs yes no yes 16729 3600 no 4224 117657 Liquid POD FAR CSI HSS BIAS N POD FAR CSI HSS BIAS N 82% 20% 68% 78% 1.03 24553 Obs yes no Freezing FD12P FD12P yes no Obs yes 15055 3650 yes 28 4261 119244 no 33 80% 22% 66% 76% 1.03 22966 POD FAR CSI HSS BIAS N Solid no Obs 28 yes 142121 no 50% 54% 31% 48% 1.09 89 POD FAR CSI HSS BIAS N FD12P yes 808 181 no 466 140755 63% 18% 56% 71% 0.78 1455 Poor skill scores found for freezing and solid precipitation Additional rules based on RH, TA, MOR evaluated with reference set Further improvement not likely -> test with ‘new’ instruments TECO-2010, Helsinki | 31 August 2010 5 Investigation of new sensors (2008-2010) KNMI selected four commercially available sensors: - with the potential to improve the observation (combined w/ FD12P) - which are suitable for use at AWS at an affordable price tag Ott Parsivel, Thies LPM, Lufft R2S, Vaisala WXT520 Setup: Field test in De Bilt September 2008-March 2010 Additional data: FD12P (2x), rain gauge, wind, PTU, … Assessment of possibilities for indoor check Reference: Evaluation by data validation specialists (10-min) and meteorologists (hourly) in a web tool Only precipitation type is used – wawa without intensity indication TECO-2010, Helsinki | 31 August 2010 6 Sensors under test Ott Parsivel Thies LPM Optical disdrometer Optical disdrometer 51cm2 sheet, 650nm 46cm2 sheet, 785nm Extinction-> D,v Extinction-> D,v 8 types: 9 types: L,LR,R,LRS,S,SG,SP,A P,L,LR,R,LRS,S,IP,SG,A Lufft R2S Vaisala WXT520 24 GHz Doppler radar RAINCAP Ø94mm Frequency shift-> v Drop impact-> volume 4 types: Distinction rain/hail: R,LRS,S,A R,A TECO-2010, Helsinki | 31 August 2010 7 Example 16 January 2010: wintry precipitation Transition from liquid to solid precipitation around 19UT Captured well by disdrometers, 2 FD12P sensors show difference R2S: mixture reported due to temperature threshold 4˚C Meteorologist confirms light drizzle detections of LPM TECO-2010, Helsinki | 31 August 2010 8 Example 16 January 2010: wintry precipitation (2) First report LRS/S R2S 1615 PAR 1842 LPM 1845 FD12 1853 TECO-2010, Helsinki | 31 August 2010 9 Example 15 December 2008: dense fog Dense fog event identified in the evening (MOR<200 m), just above 0˚C Both FD12Ps report snow and snow grains at max. 0.03 mm/h Other sensors do not report precipitation, as confirmed by meteorologist TECO-2010, Helsinki | 31 August 2010 10 Results: evaluation Hourly evaluation performed by meteorologist beside normal duties Selection of events where disagreement with FD12P was indicated Results (≠ skill scores): Hourly observations # obs. # OK / N / NOK LPM 141 56 / 0 / 85 Parsivel 141 FD12oper 141 10-min observations # obs. # OK / N / NOK LPM 269 232 / 7 / 30 31 / 0 / 110 Parsivel 269 184 / 0 / 85 22 / 0 / 119 FD12oper 269 107 / 21 / 141 TECO-2010, Helsinki | 31 August 2010 11 Results: general impression Technically OK for 18 months without maintenance Frequency distribution (10-min) LPM: UP due to spiders, some added value for hail and classification of light events, no detection in fog Parsivel: high FAR for hail types, insensitive to L/SG, solid “spider” reports (no T included) WXT520: no hail events reported, although 3 confirmed cases R2S: high FAR for LRS, insect detections, threshold D≥0.3mm TECO-2010, Helsinki | 31 August 2010 12 Conclusions and outlook None of the automated systems has perfect performance Thies LPM is able to partially solve the issues encountered with the precipitation type observation by the FD12P Analysis of the improvement limited due to availability of reference Winter 2010-2011: Second test of LPM disdrometer at airports Schiphol and Rotterdam Entry of PW changes on a 1-minute basis by human observer Optimization of combination FD12P/LPM for precipitation type LPM issues that still need to be addressed: Contribution of false reports by spider(web)s Sensitivity/threshold Wind effect on the determination of the precipitation type TECO-2010, Helsinki | 31 August 2010 13 Thanks for your attention! See paper 3(2) for further details TECO-2010, Helsinki | 31 August 2010 14 TECO-2010, Helsinki | 31 August 2010 15 TECO-2010, Helsinki | 31 August 2010 16 Indoor check Setup of test for homogeneity and reproduceability of disdrometers Prior to field test and after 1 year Problem: accurate positioning of drops in the light sheet! Peristaltic pump Droplet plate LPM Tel3: average normalized drop volume (surface plot) -5.0 0.0 5.0 L01 14.0 L02 34.0 L03 54.0 L04 74.0 L05 94.0 L06 114.0 L07 134.0 L08 154.0 L09 174.0 L10 194.0 10.0 L11 214.0 position, distance along beam (mm) 0.00-0.20 0.20-0.40 0.40-0.60 0.60-0.80 0.80-1.00 Good agreement with Thies factory calibration distance across beam (mm) -10.0 Sensor Scale TECO-2010, Helsinki | 31 August 2010 17 Contingency table 2000-2002 Observer N/A C P L LR R ZL ZR LRS S IP SG IC SP A Sum N/A FD12P PWc N/A C 719 7494 5230 117657 2 25 310 1535 98 182 545 1722 12 2 11 20 5 64 P 42 353 3 46 20 106 6 LR 154 248 7 121 365 1694 19 4 2 3 107 22 3 1 6 1 2621 54 10 12463 20 2 32 10 1 3 8 16 2 2 6937 128751 15 6 629 5331 7 9.9% 14 22 L 282 1234 1 987 760 2014 1 Band0 89.5% Band0* 47.3% R 663 2233 253 465 940 7709 ZL ZR LRS 17 13 9 3 1 2 1 2 1 3 17 2 1 2 6 2 1 4 46 Band1 93.9% 41 Band1* S 2 17 2 5 3 13 IP 10 47 3 3 2 4 1 SG 11 IC 4 26 5 35 442 1 30 4 16 9 2 2 209 587 47 160 78.2% A 2 2 1 7 59 1 19 65 81 SP 4 65 0 0 2 Sum 9396 127111 296 3474 2374 13810 31 25 316 737 8 97 0 134 15 157824 TECO-2010, Helsinki | 31 August 2010 18 Amplitude Diameter Duration Velocity TECO-2010, Helsinki | 31 August 2010 19 Classification FD12P vs disdrometer Vaisala FD12P Optisch/DRD12 = “grootte”/”waterinhoud” + temperatuur + max. deeltjesgrootte Disdrometer (bv. Ott/Thies) + evt. temperatuur TECO-2010, Helsinki | 31 August 2010 20 Intermezzo scores other method event yes Probability of detection POD = hit / (hit+miss) yes no hit miss False alarm rate FAR = false / (hit+false) none Critical succes index CSI = hit / (hit+miss+false) referen ce no false TECO-2010, Helsinki | 31 August 2010 21 Example 26 May 2009: hail event Parsivel and LPM report hail between 0215 and 0225UT Temperature drops 5˚C, radar summer hail chance >90% But unfortunately no evaluation Other sensors report heavy rain, including both FD12Ps TECO-2010, Helsinki | 31 August 2010 22 Overview Precipitation type PW code NWS code METAR code No precipitation 00 C - Unknown precipitation 40 P UP Drizzle 50 L DZ Freezing drizzle 55 ZL FZDZ Drizzle and rain 57 LR DZRA Rain 60 R RA Freezing rain 65 ZR FZRA Drizzle/rain and snow 67 LRS RASN Snow 70 S SN Ice pellets 75 IP PL Snow grains 77 SG SG Ice crystals 78 IC IC Snow pellets 87 SP GS Hail 89 A GR
