NOAA Eelgrass Part 2 - Bay Planning Coalition
advertisement
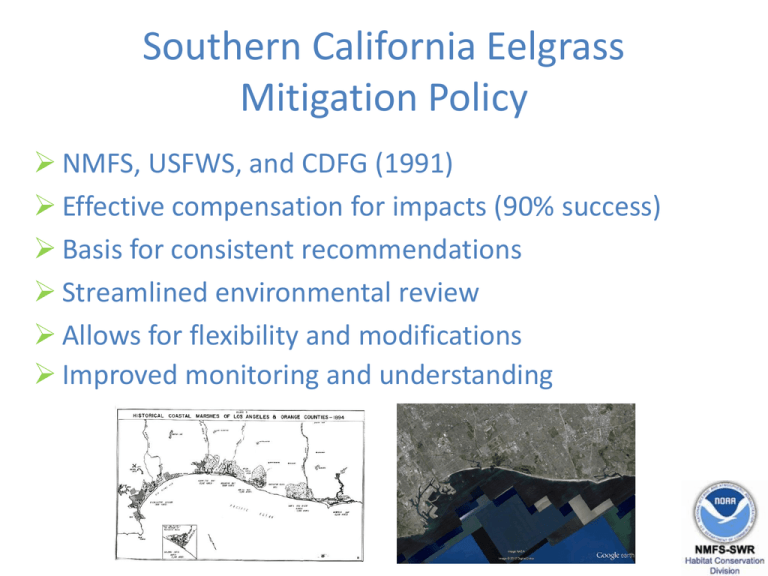
Southern California Eelgrass Mitigation Policy NMFS, USFWS, and CDFG (1991) Effective compensation for impacts (90% success) Basis for consistent recommendations Streamlined environmental review Allows for flexibility and modifications Improved monitoring and understanding III. Purpose and Need – Why statewide policy? Resource value: biological, physical and economic Vulnerable to human development Consistent statewide strategy and standards Internal and external coordination Streamlining Regulatory certainty IV. Draft Policy – General Description No net loss of habitat Consistency with case-by-case considerations Following successful model of Southern CA policy Recognizes regional differences Internal guidance and appendices V. Draft Policy – Specific Elements A. B. C. D. E. Avoiding and minimizing impacts Surveying Assessing impacts Mitigating for impacts Modifying provisions of the policy A. Impact Avoidance and Minimization Case-by-case basis Shading • Stepwise key Turbidity • Flowchart • Light monitoring Circulation Patterns B. Eelgrass Surveys Survey Metrics • • • • • Spatial distribution Area extent Percent bottom cover Shoot density Frequency of occurrence Eelgrass Bed Definition Example Eelgrass Bed eelgrass 10 m boundary Contiguous boundary around plants and outward a distance of 10 m, excluding gaps within the bed >20 m between plants B. Eelgrass Surveys (cont.) Techniques • • • • Diver transects Boundary mapping Acoustic surveys Aerial surveys Methods • Pre- and post-construction • During active growing season • Valid for 60 days or beginning of next growing season C. Assessing Impacts Type of effect: direct vs indirect Pre- and post- surveys of project and reference sites D. Mitigating for Impacts Site Selection Mitigation ratio Techniques Monitoring Delay Success Mitigation Ratios “The Five-Step Wetland Mitigation Calculator” (King and Price 2004) • Objective, standardized ratios • Standard metrics • Likelihood of success based on history of transplanting within regions Compensation ratio 1.2:1 for all regions Initial target mitigation ratio • • • • Southern California 1.38:1 Central California 1.2:1 San Francisco 3.01:1 Northern California 4.82:1 Mitigation Monitoring Mitigation site and reference site 0 months: document transplants, establish baseline at reference site 6 months: confirm survival and/or recruitment 12, 24, 36, 48, 60 months: evaluate mitigation site and compare to reference site Success Criteria Area and density criteria • • • • 6 month: 50% survival or 1 seedling/4m2 12 month: 40% area and 20% density 24 months: 85% area and 70% density 36, 48, 60 months: 100% area and 85% density Supplemental Mitigation Area Mitigation Delay To offset loss of eelgrass habitat value that accumulates over time Mitigation calculator used to determine increases in mitigation planting E. Modifying Provisions Comprehensive management strategies Localized, temporary impacts • Less than 10 m2 • Eelgrass fully restored within 1 year Region-specific modifications Mitigation banking VI. Next Steps Public comment • swr.cemp@noaa.gov • Closes 7/7 Public meetings • Eureka (6/15) • Oakland (6/27) • Long Beach (6/26) Revise and finalize


