7 - Cal State LA - Instructional Web Server
Unit 7: Temperatures of the Lower
Atmosphere
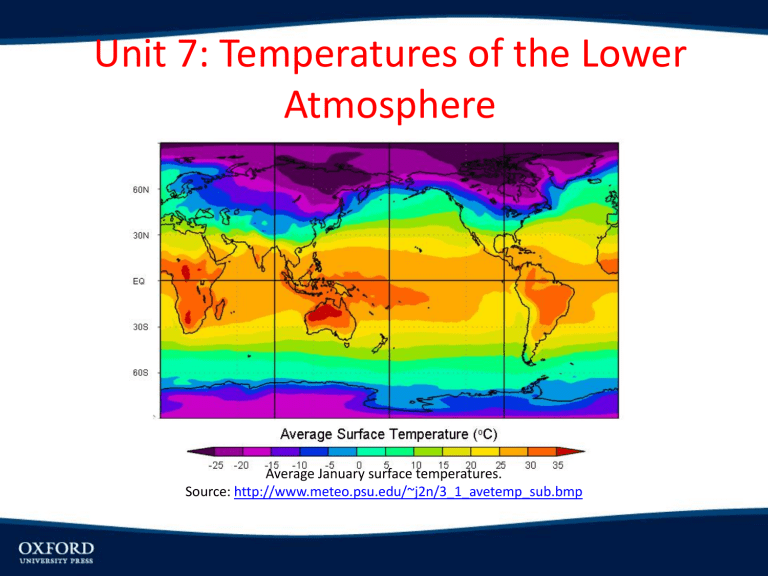
Average January surface temperatures.
Source: http://www.meteo.psu.edu/~j2n/3_1_avetemp_sub.bmp
OBJECTIVES
• Discuss the measurement and characteristics of temperature and heat
• Explain the adiabatic process whereby vertically moving air warms and cools
• Discuss the global distribution of temperatures and their variation in time and space
Temperature, Temperature Scales
• What is temperature?
• Thermometers
• Scales: Celsius, Fahrenheit, Kelvin
Source: http://www.windows2universe.org/physical_science/basic_tools/images/thermometers_kelvin_celsius_fahrenheit_sm.gif
The Vertical Distribution of Temperature
• Environmental Lapse Rate
• Adiabatic Lapse Rates
-Dry Adiabatic Lapse Rate (DALR)
- Saturated Adiabatic Lapse Rate (SALR)
• Stability
-stable
-inversions (ground, subsidence)
-unstable
-conditionally stable
Source: http://www.fas.org/irp/imint/docs/rst/Sect14/Sect14_1b.html
• Stability and Air Pollution
James Glaisher and his assistant, Coxwell, during a balloon flight on September 5, 1862.
Concept of Stability
Source: http://epswww.unm.edu/facstaff/gmeyer/envsc101/wk11atmcompcirc.htm
Environmental lapse rate conditions
Source: h ttps://www.meted.ucar.edu/sign_in.php?go_back_to=http%253A%252F%252Fwww.meted.ucar.edu%252Fmesoprim%252Fbandedprecip%25
2Fprint.htm
In an unstable atmosphere numerous thunderstorms billow up as viewed over southern Florida looking south.
Downtown Los Angeles is a leading city of air pollution due to poor vertical and horizontal mixing. Throughout the summer, there is a restrictive temperature inversion over the region. Adopting the strictest air pollution controls in the world, the air quality has improved remarkably.
Fig. 8.7 3 rd ed.
Horizontal Distribution of Temperature
• Temporal cycles
-Daily cycle
-Annual cycle
• Heating of land vs. water
-maritime effect
-continental effect, continentality
• Global temperature variations
-seasonal variations
-isotherms and temperature gradients
Figure 3.12
Daily Radiation Patterns
Land–Water Heating Differences
Figure 3.20
The annual range in sea surface temperature (A) and the lag between maximum solar heating and the date of maximum temperature (B).
Fig 8.9-annual temperature regimes for inland vs coast
Effects of
Latitude
Figure 3.17
Annual Temperature Regime in Siberia
Source: http://www.verkhoyansk.climatemps.com/
Mean sea-level air temperatures, in Fahrenheit for January
Source: http://apollo.lsc.vsc.edu/classes/met130/notes/chapter3/graphics/jan_temps.jpg
Mean sea-level air temperatures, in Fahrenheit for July
Source: http://apollo.lsc.vsc.edu/classes/met130/notes/chapter3/graphics/july_temps.jpg
Figure 3.28
Global Temperature Ranges
Figure 3.30
Urban Heat Island
Air Temperature and
• Wind chill
the Human Body
– Correlates cold and wind speed
• Heat index
– Correlates heat and humidity
Figure 1
Wind Chill Table
Figure 2
