B-spline Model of Ionospheric Scintillation 11th European
advertisement
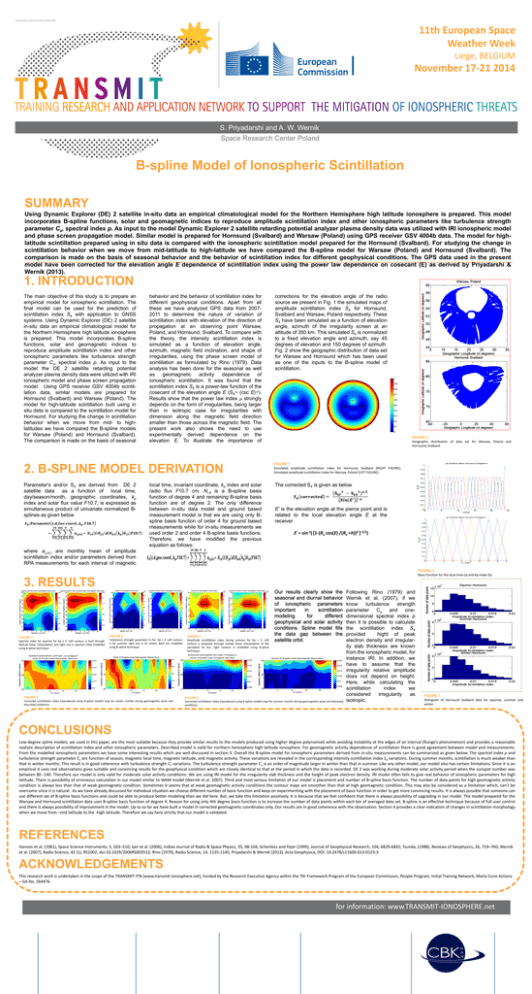
11th European Space Weather Week Liege, BELGIUM November 17-21 2014 S. Priyadarshi and A. W. Wernik Space Research Center Poland B-spline Model of Ionospheric Scintillation SUMMARY Using Dynamic Explorer (DE) 2 satellite in-situ data an empirical climatological model for the Northern Hemisphere high latitude ionosphere is prepared. This model incorporates B-spline functions, solar and geomagnetic indices to reproduce amplitude scintillation index and other ionospheric parameters like turbulence strength parameter Cs, spectral index p. As input to the model Dynamic Explorer 2 satellite retarding potential analyzer plasma density data was utilized with IRI ionospheric model and phase screen propagation model. Similar model is prepared for Hornsund (Svalbard) and Warsaw (Poland) using GPS receiver GSV 4004b data. The model for highlatitude scintillation prepared using in situ data is compared with the ionospheric scintillation model prepared for the Hornsund (Svalbard). For studying the change in scintillation behavior when we move from mid-latitude to high-latitude we have compared the B-spline model for Warsaw (Poland) and Hornsund (Svalbard). The comparison is made on the basis of seasonal behavior and the behavior of scintillation index for different geophysical conditions. The GPS data used in the present model have been corrected for the elevation angle E dependence of scintillation index using the power law dependence on cosecant (E) as derived by Priyadarshi & Wernik (2013). 1. INTRODUCTION The main objective of this study is to prepare an empirical model for ionospheric scintillation. The final model can be used for the prediction of scintillation index S4 with application to GNSS systems. Using Dynamic Explorer (DE) 2 satellite in-situ data an empirical climatological model for the Northern Hemisphere high latitude ionosphere is prepared. This model incorporates B-spline functions, solar and geomagnetic indices to reproduce amplitude scintillation index and other ionospheric parameters like turbulence strength parameter Cs, spectral index p. As input to the model the DE 2 satellite retarding potential analyzer plasma density data were utilized with IRI ionospheric model and phase screen propagation model. Using GPS receiver GSV 4004b scintillation data, similar models are prepared for Hornsund (Svalbard) and Warsaw (Poland). The model for high-latitude scintillation built using in situ data is compared to the scintillation model for Hornsund. For studying the change in scintillation behavior when we move from mid- to highlatitudes we have compared the B-spline models for Warsaw (Poland) and Hornsund (Svalbard). The comparison is made on the basis of seasonal behavior and the behavior of scintillation index for different geophysical conditions. Apart from all these we have analyzed GPS data from 20072011 to determine the nature of variation of scintillation index with elevation of the direction of propagation at an observing point Warsaw, Poland, and Hornsund, Svalbard. To compare with the theory, the intensity scintillation index is simulated as a function of elevation angle, azimuth, magnetic field inclination, and shape of irregularities, using the phase screen model of scintillation as formulated by Rino (1979). Data analysis has been done for the seasonal as well as geomagnetic activity dependence of ionospheric scintillation. It was found that the scintillation index S4 is a power-law function of the cosecant of the elevation angle E (S4~ (csc E)-m). Results show that the power law index m strongly depends on the form of irregularities, being larger than in isotropic case for irregularities with dimension along the magnetic field direction smaller than those across the magnetic field. The present work also shows the need to use experimentally derived dependence on the elevation E. To illustrate the importance of 2. B-SPLINE MODEL DERIVATION Parameter's and/or S4 are derived from DE 2 satellite data as a function of local time, day/season/month, geographic coordinates, kp index and solar flux value F10.7, is expressed as simultaneous product of univariate normalized Bsplines as given below local time, invariant coordinate, kp index and solar radio flux F10.7 cm. Ni,4 is a B-spline basis function of degree 4 and remaining B-spline basis function are of degree 2. The only difference between in-situ data model and ground based measurement model is that we are using only Bspline basis function of order 4 for ground based measurements while for in-situ measurements we used order 2 and order 4 B-spline basis functions. Therefore, we have modified the previous equation as follows: corrections for the elevation angle of the radio source we present in Fig. 1 the simulated maps of amplitude scintillation index S4 for Hornsund, Svalbard and Warsaw, Poland respectively. These S4 have been simulated as a function of elevation angle, azimuth of the irregularity screen at an altitude of 350 km. This simulated S4 is normalized to a fixed elevation angle and azimuth, say 45 degrees of elevation and 150 degrees of azimuth. Fig. 2 show the geographic distribution of data set for Warsaw and Hornsund which has been used as one of the inputs to the B-spline model of scintillation. FIGURE 2 Geographic distribution of data set for Warsaw, Poland and Hornsund, Svalbard. FIGURE 1 Simulated amplitude scintillation index for Hornsund, Svalbard [RIGHT FIGURE]; Simulated amplitude scintillation index for Warsaw, Poland [LEFT FIGURE]. The corrected S4 is given as below E′ is the elevation angle at the pierce point and is related to the local elevation angle E at the receiver E’ = sin-1( [1-(Re cos(E) /(Re +h))2 ]-1/2) where ai,j,k,l are monthly mean of amplitude scintillation index and/or parameters derived from RPA measurements for each interval of magnetic FIGURE 3 Basis function for the local time (a) and Kp-index (b). 3. RESULTS FIGURE 4 Spectral index for equinox for Kp ≤ 3. Left contour is built through MatLab linear interpolation and right one is spectral index modelled using B-spline technique. FIGURE 5 Turbulence strength parameter Cs for Kp > 3. Left contour is for summer right one is for winter. Both are modelled using B-spline technique. FIGURE 8 Corrected scintillation index (reproduced using B-spline model) map for winter months during geomagnetic quiet and disturbed conditions. FIGURE 6 Amplitude scintillation index during summer for Kp > 3. Left contour is prepared through matlab linear interpolation of the calculated S4 but, right contour is modelled using B-spline technique. Our results clearly show the seasonal and diurnal behavior of ionospheric parameters important in scintillation modeling for different geophysical and solar activity conditions. Spline model fills the data gap between the satellite orbit. FIGURE 9 Corrected scintillation index (reproduced using B-spline model) map for summer months during geomagnetic quiet and disturbed conditions. Following Rino (1979) and Wernik et al. (2007), if we know turbulence strength parameter Cs and onedimensional spectral index p then it is possible to calculate the scintillation index S4 provided hight of peak electron density and irregularity slab thickness are known from the ionospheric model, for instance IRI. In addition, we have to assume that the irregularity relative amplitude does not depend on height. Here, while calculating the scintillation index we considered irregularity as isotropic. FIGURE 7 Histogram of Hornsund Svalbard data for equinox, summer and winter. CONCLUSIONS Low-degree spline models, we used in this paper, are the most suitable because they provide similar results to the models produced using higher degree polynomials while avoiding instability at the edges of an interval (Runge’s phenomenon) and provides a reasonable realistic description of scintillation index and other ionospheric parameters. Described model is valid for northern hemisphere high latitude ionosphere. For geomagnetic activity dependence of scintillation there is good agreement between model and measurements. From the modelled ionospheric parameters we have some interesting results which are well discussed in section 3. Overall the B-spline model for ionospheric parameters derived from in-situ measurements can be summarized as given below. The spectral index p and turbulence strength parameter Cs are function of season, magnetic local time, magnetic latitude, and magnetic activity. These variations are revealed in the corresponding intensity scintillation index S4 variations. During summer months, scintillation is much weaker than that in winter months. This result is in good coherence with turbulence strength Cs variations. The turbulence strength parameter Cs is an order of magnitude larger in winter than that in summer. Like any other model, our model also has certain limitations. Since it is an empirical it uses real observations gives suitable and convincing results for the geophysical condition which are closely identical to that at the period in which the data is recorded. DE 2 was working during moderate solar activity period when the sunspot number was between 80 -140. Therefore our model is only valid for moderate solar activity conditions. We are using IRI model for the irregularity slab thickness and the height of peak electron density. IRI model often fails to give real behavior of ionospheric parameters for high latitude. There is possibility of erroneous calculation in our model similar to WAM model (Wernik et al. 2007). Third and most serious limitation of our model is placement and number of B-spline basis function. The number of data points for high geomagnetic activity condition is always less than that of weak geomagnetic condition. Sometimes it seems that at weak geomagnetic activity conditions the contour maps are smoother than that at high geomagnetic condition. This may also be considered as a limitation which, can’t be overcome since it is natural. As we have already discussed for individual situation we choose different number of basis function and keep on experimenting with the placement of basis function in order to get more convincing results. It is always possible that someone can use different set of B-spline basis functions and could be able to produce better modeling than we did here. But, we take this limitation positively. It is because that we feel confident that there is always possibility of upgrading in our model. The model prepared for the Warsaw and Hornsund scintillation data uses B-spline basis function of degree 4. Reason for using only 4th degree basis function is to increase the number of data points within each bin of averaged data set. B-spline is an effective technique because of full user control and there is always possibility of improvement in the model. Up to so far we have built a model in corrected geomagnetic coordinates only. Our results are in good coherence with the observation. Section 4 provides a clear indication of changes in scintillation morphology when we move from –mid latitude to the -high latitude. Therefore we say here strictly that our model is validated. REFERENCES Hanson et al. (1981), Space Science Instruments, 5, 503–510; Iyer et al. (2006), Indian Journal of Radio & Space Physics, 35, 98-104; Scherliess and Fejer (1999), Journal of Geophysical Research, 104, 6829-6842; Tsunda, (1988), Reviews of Geophysics, 26, 719–760; Wernik et al. (2007), Radio Science, 42 (1), RS1002, doi:10.1029/2006RS003512; Rino (1979), Radio Science, 14, 1135-1145; Priyadarshi & Wernik (2013), Acta Geophysica, DOI: 10.2478/s11600-013-0123-3 ACKNOWLEDGEMENTS This research work is undertaken in the scope of the TRANSMIT ITN (www.transmit-ionosphere.net), funded by the Research Executive Agency within the 7th Framework Program of the European Commission, People Program, Initial Training Network, Marie Curie Actions – GA No. 264476. for information: www.TRANSMIT-IONOSPHERE.net
