Scatterometer Wind Climate Data Records
advertisement
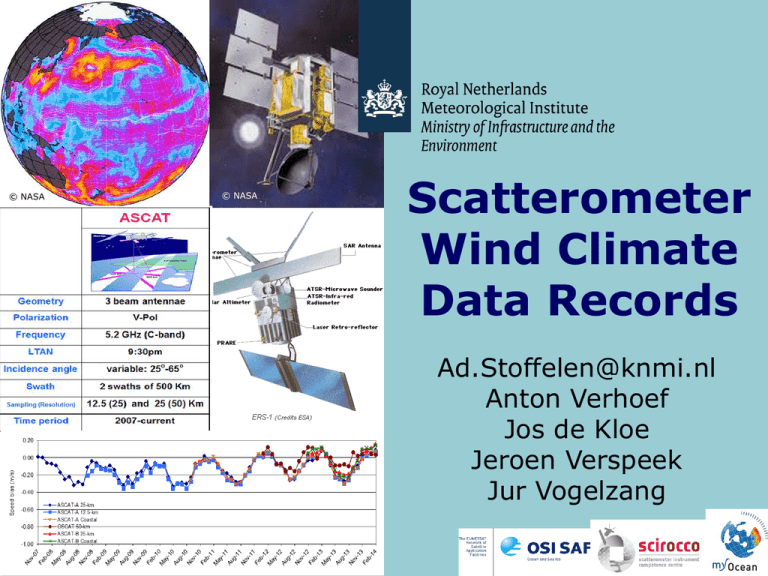
© NASA © NASA Scatterometer Wind Climate Data Records Ad.Stoffelen@knmi.nl Anton Verhoef Jos de Kloe Jeroen Verspeek Jur Vogelzang © NASA © NASA Outline • Motivation • Planning • Preparation and methods • Quality Monitoring • Output data and formats • Results Wind stress ECV Radiometers/scatterometers measure ocean roughness Ocean roughness consists in small (cm) waves generated by air impact and subsequent wave breaking processes; depends on water mass density rsea= 1024±4 kg m-3 and e.m. sea properties (assumed constant) Air-sea momentum exchange is described by t = rair u* u* , the stress vector; depends on air mass density rair , friction velocity vector u* Surface layer winds (e.g., u10) depend on u* , atmospheric stability, surface roughness and the presence of ocean currents Equivalent neutral winds, u10N , depend only on u* , surface roughness and the presence of ocean currents and is currently used for backscatter geophysical model functions (GMFs) √ rair . u10N is suggested to be a better input for backscatter GMFs (stress-equivalent wind ; under evaluation by IOVWST) Planning We plan to re-process the following inter-calibrated data sets Metop-A ASCAT winds and ice probabilities, 25 km and 12.5 km Coastal, 2007-2013, data set to become available in 2014 QuikSCAT SeaWinds winds and ice probabilities, 50 and 25 km, 1999-2009, data set to become available in 2014 ERS-1 and ERS-2 winds, 25 km, 1991-2001, availability depending on the ESA SCIROCCO project to provide consistency between ERS and ASCAT backscatter records (2015) Oceansat-2 OSCAT winds and ice probabilities, 50 and 25 km, 2009 to 2014, to be reprocessed in 2015 In this way we can create a continuous ocean winds data record from 1991 to today 4 Reprocessing – software and calibration Reprocessing will be done using the wind processing software packages which are publicly available in the NWP SAF (AWDP, SDP, OWDP, …) Data from different sensors will be inter-calibrated using buoy winds, ECMWF model winds and established methods, such as triple collocation Our goal is to calibrate the winds to a level as close as possible to the buoy winds Follow GCOS guidelines 5 Precision, Accuracy: Triple Collocation u v Bias ASCAT (m/s) Bias ECMWF (m/s) 0.15 0.28 -0.02 0.08 Trend ASCAT Trend ECMWF 1.01 1.03 1.01 1.04 ASCAT (m/s) ECMWF (m/s) 0.69 1.50 0.81 1.52 Representation error (m/s) 0.79 1.00 Representation error is part of ECMWF error OSI SAF NRT req. 2 m/s, WMO in speed/dir. See also Vogelzang et al., JGR, 2011 Spatial representation error from spectrum difference integrated over scales from 25 km to 800 km Ku-band GMF The NSCAT-2 GMF still has superior performance and is available for all necessary incidence angles, so usable for QuikSCAT, OSCAT and other instruments NSCAT-2 has evolved to NSCAT-4 to reduce, i.a., wind speed biases at high wind speeds (left: ECMWF, right: buoys) http://www.knmi.nl/scatterometer/nscat_gmf/ 7 Ku-band instrument processing NWP Ocean Calibration works very well for ASCAT to calibrate the winds using a limited amount of data This method is more challenging for Ku-band due to issues with Quality Control and representativeness of data, but we are better understanding the issues now We are working on improvements in Quality Control, moving the actual QC step from before to after the Ambiguity Removal, results look promising in terms of buoy verifications Current method: Wind inversion -> Quality Control -> Ambiguity Removal New method: Wind inversion -> Preliminary QC -> Ambiguity Removal -> Quality Control 8 QC changes climate? We can produce winds with SD of buoy-scatterometer difference of 0.6 m/s, but would exclude all high-wind and dynamic air-sea interaction areas The winds that we reject right now in convective tropical areas are noisy (SD=1.84 m/s), but generally not outliers! What metric makes sense for QC trade-off? MLE>+18.6 SDf = 2.31 ms-1 SDf = 1.84 ms-1 SDf = 0.6 ms-1 ECMWF ERA-interim ECMWF ERA-Interim wind forecast data will be used to initialize the ambiguity removal step and to monitor the data records ERA-Interim data are available over the entire period (in fact from 1979 to present) and produced with a single version of ECMWF’s Integrated Forecast System, i.e., is a climate reference ERA-Interim fields are retrieved without interpolation error on a reduced Gaussian grid with approximately 79 km spacing Although data from the operational model are available at higher resolution for most periods, they have varying characteristics over time so we will not use them (up to 0.2 m/s changes) ERA-Interim does not have equivalent neutral 10m winds (U10N) archived; we compute them from the real 10m winds, SST, T and Q using a stand-alone implementation of the ECMWF model surface layer physics (tested using real 10m and U10N winds from the operational model) and will put them available at KNMI 10 Sampling error All scatterometers sample the atmosphere spatially and temporally in a non-uniform way due to swath geometry and QC (rain); this causes substantial sampling errors ERA-interim U10N is collocated in time and space with all (valid) scatterometer winds and processed to the same L2 and L3 products Users may thus compare the spatial and temporal mean ERA-interim values as sampled by the scatterometer with uniformly sampled ERA-interim values in order to obtain an estimate of the sampling error fields of the scatterometer Improved spatial and temporal averages are thus obtained by subtracting the estimated sampling error from ERAinterim from the scatterometer climatology 11 Monitoring Exploit NRT experience Daily averages of several parameters are plotted over the entire time range in order to detect any missing data or anomalies Different parts of the swath are considered separately Important quality indicators are wind speed difference w.r.t. ECMWF winds, MLE and number of Quality Controlled WVCs Weekly ocean calibration Deviations in product quality (anomalies) usually appear as a step in one or more of the plots 12 Monitoring - Buoy Collocations Monthly statistics of scatterometer winds vs. buoy winds are being made Plot below shows the buoy statistics of several near-real time OSI SAF wind products over time, the same will be done in the reprocessing and this will help to get optimal calibration of data from different instruments. > Seasonal cycle in wind variability 13 Wi nd speed bi as (m/s) Wi nd speed bi as (m/s) WCRP requirement for accuracy Trends appear slightly higher, but different ERA goes up by 0.1 m/s QuikScat drops by 0.05 m/s QuikScat@Buoys drops by 0.5 m/s Buoys drop 0.3 m/s Bias trends appear rather independent of sample (TBC) Wi nd speed bi as (m/s) 0.1 m/s per decade ? QuikScat - ERA 0.5 0.4 0.3 0.2 0.1 0.0 -0.1 -0.2 -0.3 0.51-1999 1-2000 1-2001 1-2002 1-2003 1-2004 1-2005 1-2006 1-2007 1-2008 1-2009 1-2010 0.4 0.3 0.2 0.1 0.0 -0.1 -0.2 -0.3 0.51-1999 1-2000 1-2001 1-2002 1-2003 1-2004 1-2005 1-2006 1-2007 1-2008 1-2009 1-2010 0.4 0.3 0.2 0.1 0.0 -0.1 -0.2 -0.3 1-1999 1-2000 1-2001 1-2002 1-2003 1-2004 1-2005 1-2006 1-2007 1-2008 1-2009 1-2010 QuikScat - buoy QuikScat – buoy, 25N+ Trends in extreme wind speed Trend in 90th Percentile Controversy in trends of mean and extremes – Wentz, F. J., and L. Ricciardulli, 2011, Science – Young, I. R., S. Zieger, and A. V. Babanin, 2011: Science QuikSCAT Trend in Wind Speed (in 0.1 m/s per 10 year) Figure by Jason Keefer and Mark Bourassa, FSU Local trends of 1 m/s are quite feasible Satellite, NWP and buoy sampling see different trends ASCAT hits on Vongfong 50 ASCAT B ASCAT A 40 30 710 -1 4 710 00: 12 -1 4 710 12: 03 -1 4 710 12: 51 -1 4 810 23: 51 -1 4 910 00: 42 -1 4 910 12: 09 -1 4 13 :0 3 20 Peak around midnight on 7/8 October 2014 of 42 m/s (150 km/h) ASCAT-A appears low as compared to ASCAT-B Current calibration bias B-A of 0.1 dB (0.1 m/s) Required accuracy is 0.2 dB Due to GMF saturation, 0.1 dB at 40 m/s is 4 m/s ! For extremes more careful instrument calibration is needed Next generation ASCAT will have VH pol. channel CDR status Several producers (a.o. OSI SAF) provide OVW CDRs, which are defensible by their own verification metric These products cannot be easily understood nor combined by the user community Mature (5) stable products exist over long times, but not reprocessed according to GCOS guidelines; some uncoordinated reprocessing plans exist Matchup data bases exist too, but by producer Moored buoys are the main reference, but lacking in open ocean Quality metrics and assessment standards (software) exist too by producer, but spatial resolution (at given sampling), wind speed scale, wind quality to be coordinated/agreed The IOVWST starts to address ECV coordinated needs but needs higher-level support CEOS Virtual Constellation coordinates satellites/products Sept 2011 (Independent) Verification Compare products with other producers Product improvements Wind and stress products and formats Level 2 swath backscatter, wind and ice data will be provided in BUFR format, identical to the near-real time data Level 2 swath data for wind, stress, rotation and divergence in NetCDF All NetCDF data according to the climate (CF) conventions Separate level 2 products for wind/stress on one hand and rotation/divergence on the other hand are considered since the swath grids are slightly different and to maintain continuity in the current NetCDF level 2 products Level 3 data on lat/lon grid for wind, stress, rotation and divergence in NetCDF Data will be archived and made available in the EUMETSAT Data Centre, EU MyOcean archive and PO.DAAC (TBC) 19 Ice maps Ice probability and ice age (Aparameter, albedo) are computed as part of the Bayesian ice screening procedure Daily ice maps in Polar Stereographic projection will be made available in NetCDF format The format is according to the NetCDF-CF conventions 20 Summary Wind climate data records will be created from several scatterometer missions spanning more than 20 years in total Focus will be on a proper inter-calibration of the various data records The latest versions of wind processing software will be used to get state of the art wind products Information will be provided to estimate sampling errors Wind and ice map data will be provided by various archives both in BUFR and user-friendly NetCDF-CF formats Work on NetCDF-CF standards and internationally agreed DOIs Need enhanced resources for international collaboration/standards scat@knmi.nl www.eumetsat.int/website/home/Data/DataDelivery/EUMETSATDataCentre/ www.myocean.eu podaac.jpl.nasa.gov/ (TBC) 21 © NASA © NASA Convoy Workshop, 9-11 Oct 2013 16 February 2014, near 0E, 3N 9:15 9:30 9:45 10:00 10:15 10:30 9:45 9:45 9:00 KNMI MSG rain © NASA © NASA ASCAT ASCAT div ASCAT rot © NASA © NASA Convergence and curl structures associated with convective cell Accelarated inflow and precipitation is associated with wind downburst Shear zones with curl (+ and -) Rain appears to do little with the wind signal Motivation The EUMETSAT Ocean and Sea Ice Satellite Application Facility produces near-real time wind data from several scatterometer instruments since many years An increasing number of users uses scatterometer wind data for climate studies However, the wind retrieval algorithms have been continuously improved over the years and the currently existing archives of near-real time data are not always suitable to fulfil the need for homogeneous data sets spanning a longer period of time Most of the archives contain near-real time processed data and currently only few consistent and validated vector wind climate data sets are available 25
