Offshore Wind-global progress - Thoughts of a Lapsed Physicist
advertisement
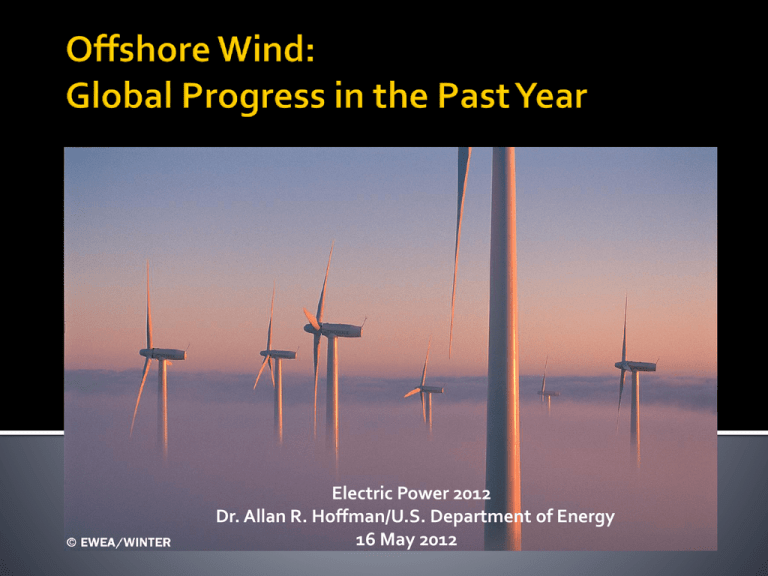
Electric Power 2012 Dr. Allan R. Hoffman/U.S. Department of Energy 16 May 2012 Why offshore wind and how big is the resource? Statistics from one year ago Current statistics The USG offshore wind program Concluding remarks 2 Offshore Wind (OSW) has the potential, when widely deployed, to address two critical issues facing the nation the need for new electrical energy sources that are ▪ carbon-free ▪ renewable ▪ indigenous to the U.S. the need to stimulate the economy and create new jobs 3 OSW power plants can produce up to 50% more electricity than onshore cousins due to higher and steadier wind speeds Proximity to major U.S. load centers with high average electricity costs 50% of Americans live within 50 miles of a coast Other advantages over onshore locations allows deployment of larger wind turbines reduced visual impacts less turbulence lower noise constraints (allowing higher rotor speeds) 4 5 OSW is a large, broadly distributed, U.S. energy resource thirty U.S. states border an ocean or Great Lake NREL-estimated gross resource at 90m hub height out to 50 nm ▪ wind speeds > 7 m/s: ~3,000 GW ▪ wind speeds > 8 m/s: ~4,000 GW ▪ U.S. installed generating capacity: ~1,000 GW The global OSW resource is abundant, with the U.S. potential ranked second only to China’s European Union countries have been first movers and currently lead the world in installed offshore wind power 6 Installed OSW capacity (end of 2010): European Union: ▪ 2.9 GW in 45 wind farms and 9 countries ▪ 1,136 turbines ▪ foundations: 65% monopiles ▪ average wind farm size: 155 MW ▪ average water depth: 17.4 m ▪ Average distance to shore: 27 km China: ▪ first OSW wind farm connected to grid: 3 MW x 34 = 102 MW ▪ ten other individual OSW turbines in operation ▪ size range: 1.5-2 MW 7 Installed OSW capacity (end of 2011): European Union (overall): ▪ 3.8GW in 53 wind farms in 10 countries ▪ ▪ ▪ ▪ ▪ ▪ 1,371 turbines foundations: 75% monopiles; 21% gravity-based two full scale grid-connected floating turbines (2-3MW) average wind farm size: 200 MW average water depth: 22.8 m average distance to shore: 23.4 km this is a decrease from 2010 average distance for wind farms under construction: 33.2 km 8 Rated by nameplate capacity: ▪ United Kingdom ▪ Walney (phases 1 & 2): 367 MW ▪ Thanet: 300 MW ▪ Linn & Inner Dowsing: 194 MW ▪ Robin Rigg: 180 MW ▪ Gunfleet Sands: 172 MW • Ormonde: 150 MW • Kentish Flats: 90 MW • Barrow: 90 MW • Burbo Bank: 90 MW • Rhyl Flats: 90 MW 9 Denmark Horns Rev II: 209 MW Rodsand II: 207 MW Nysted: 166 MW Belgium Bligh Bank: 165 MW Netherlands Princess Amalia: 120 MW Egmond on Zee: 108 MW Sweden Lillgrund: 110 MW Germany Alpha Ventus: 60 MW Baltic I: 48 MW 10 China: Donghai Bridge: 102 MW Longyuan Rudong Intertidal: 131.3 MW 11 United Kingdom: London Array (Phase I): 630 MW Greater Gabbard: 504 MW Sheringham Shoal: 315 MW Lincs: 270 MW Teesside: 62 MW Germany: Trianel Borkum West II: 400 MW BARD Offshore I: 400 MW Denmark: Anholt: 400 MW Belgium: Thortonbank Phase 2: 148 MW China: Datang Laizhou III: 50 MW 12 United Kingdom: Dogger Bank: 9,000 MW (13,000 MW potential) Norfolk Bank: 7,200 MW Irish Sea: 4,200 MW Hornsea: 4,000 MW Firth of Forth: 3,500 MW Bristol Channel: 1,500 MW Moray Firth: 1,300 MW Triton Knoll: 1,200 MW Sweden: Blekinge Offshore: 2,500 MW South Korea: Korea Offshore: 2,500 MW 13 “A National Offshore Wind Strategy: Creating an Offshore Wind Energy Industry in the United States” http://www1.eere.energy.gov/wind/pdfs/national_offshore_wind_strategy.pdf announced jointly by DOE and DOI February 2011 goals: ▪ 2020: 10 GW installed @ $0.10/kWh ▪ 2030: 54 GW installed @ $0.07/kWh Department of the Interior critical partner – has primary jurisdiction over OSW projects in federal waters announced “Smart from the Start” initiative November 2010 • To facilitate project siting, leasing , construction off the Atlantic Coast • http://www.whitehouse.gov/blog/2011/02/10/smart-start-building-clean-energy-future 14 DOE actions in support of the Strategic Plan: February 2011: announced release of three solicitations (up to $50.5 over five years): • Technology Development (up to $25M over 5 years) -support development of innovative wind turbine design tools and hardware ▪ Removing Market Barriers (up to $18M over 3 years): - support baseline studies and targeted environmental research to characterize key industry sectors and factors limiting the deployment of offshore wind. ▪ Next-Generation Drivetrain (up to $7.5M over 3 years): - fund development and refinement of next-generation designs for wind turbine drivetrains 15 DOI actions in advance and support of the Strategic Plan: June 2010: Interior and 10 East Coast states form OSW Consortium to promote development of OCS wind resources along East Coast ME, NH, MA, RI, NY, NJ, DE, MD, VA, NC February 2011: identified four mid-Atlantic Outer Continental Shelf Wind Energy Areas as part of ‘Smart from the Start’: Delaware (122 square nautical miles) Maryland (207 ) New Jersey (417) Virginia (165) April 2012: released draft EIS for assessing OSW resource potential in Mid- and South-Atlantic planning areas 16 New Funding Opportunity Announcement by DOE (1 March 2012): six-year $180M initiative that seeks applications for Research Addressing Market Barriers reflects increased focus in Wind Power Program on OSW Includes $20M in FY2012, to fund up to four OSW projects designed to ▪ drive down cost of OSW farms ▪ reduce concerns about ease of permitting, offshore installations, grid integration ▪ reassure financiers about value of investments Letters of Intent were due March 30th applications due May 31st 17 private sector initiative offshore high-voltage direct-current transmission line off the mid-Atlantic Coast, capable of serving up to 7,000 megawatts of power from OSW farms December 2011: DOI completed internal review of AWC’s Right-of-Way application, prior to its release for public review Project, if deployed, would span 300 miles of state and federal waters from NJ/NY to VA 18 A year ago I concluded a talk on OSW with following words: - offshore wind is the most important emerging renewable energy technology - it can, and must, become an important part of the U.S. energy picture and its future economic growth - the U.S. is well behind the Europeans and China at this early stage of OSW development and deployment - nevertheless, given the U.S. resource base, our ability to innovate, and our broad and excellent manufacturing base, we can eventually play a major and even dominant role in OSW if we decide as a nation to do so. These conclusions are still valid today, with the following caveats: One year later the decision has been made to put increasing focus in DOE’s future Wind Power Program on OSW DOE has committed $180M over six years ($20M in FY2012) to getting OSW equipment in the waters off of U.S. coasts 19 Contact information: E-mail: allan.hoffman@ee.doe.gov Telephone: 202 /586-8302 20
