Public Lecture Powerpoint slides
advertisement

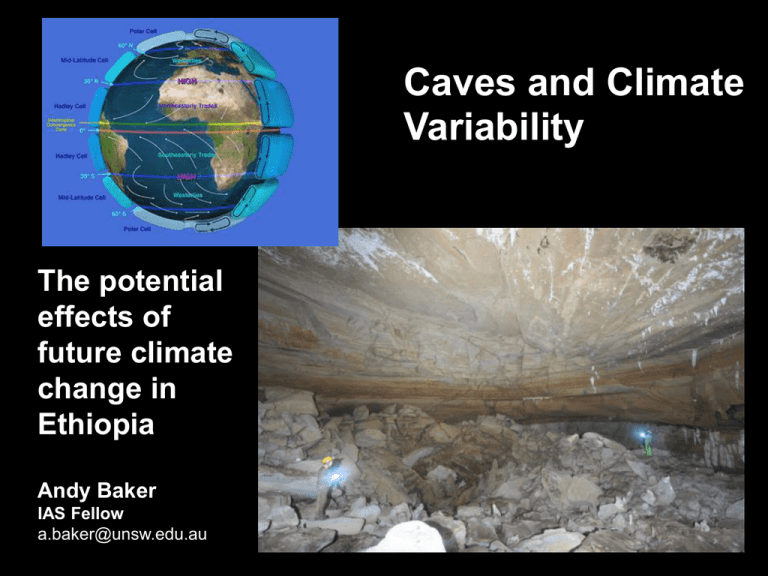
Caves and Climate Variability The potential effects of future climate change in Ethiopia Andy Baker IAS Fellow a.baker@unsw.edu.au Nott, J., Haig, J., Neil, H. and Gilleson, D., 2007. Greater frequency variability of landfalling tropical cyclones at centennial compared to seasonal to decadal scales. Earth and Planetary Science Letters, 255, 367- 1. Understanding how water moves from the surface to a cave Fairchild, I.J., Tuckwell, G.W., Baker, A. and Tooth, A.F., 2006. Modelling of dripwater hydrology and hydrogeochemistry in a weakly karstified aquifer (Bath, UK): implications for climate change studies. Journal of Hydrology, 321, 213-231 The bath as an analogy for limestone hydrogeology Tap - rainfall Bath flooding – extreme rainfall outlet Bath water – existing stored groundwater Overflow – high rainfall outlet Bath – storage capacity of the limestone Plughole – main outlet 2. Tracers of water movement from the surface to a cave So, rainwater will reach a cave, often with complex choice of flow paths. What climate and environmental signals will it carry? 1. 2. 3. 4. From the atmosphere From the soil and vegetation From the geology From the cave Picture drawn by Kevin Burkhill, Cartography, Birmingham Rainfall (H2O) Most useful are oxygen isotopes. 16O and 18O Vary geographically (with latitude, with altitude, with source region) and with time (seasonally, between years) Relative amounts of each isotope can provide information of rainfall amount and source Image: British Geological Survey 18O 16O Rainfall interacts with soil and vegetation Water can be stored as soil water. Water can be lost and fractionated by evaporation. Soils are rich in carbon dioxide produced from microbial respiration. This is dissolved into the water. Soil and vegetation biomarkers are transported by the water 16O Soil water reaches the limestone. Limestone is dissolved and the water enters the ground water. Mixing of ground water of different flow paths Mixing of water isotope tracer. Loss and degradation of the biomarker tracer. Addition of geological tracers such as Mg and Sr. Water reaches the cave The CO2 dissolved in the water degasses, and stalagmites and stalactites are formed. Water isotopes might fractionate if this process is rapid. The isotopes are preserved in the speleothem (CaCO3). Biomarkers and geological tracers are also preserved in the speleothem. Again, some changes will occur during speleothem formation. 3. Some environmental signals preserved in stalagmites pollen annual growth rings lipids oxygen isotopes Images: D. Genty, I. Fairchild Pollen Pine and oak pollen preserved in stalagmites formed 50,000 - 60,000 years ago on the Yorkshire Dales. When the climate was meant to be like this....? White, M.J., 2006. Things to do in Doggerland when you're dead: surviving OIS3 at the northwestern-most fringe of Middle Palaeolithic Europe. World Archaeology, 38,547-575 Lipids Annual laminae Trouet, V., Esper, J., Graham, N.E., Baker, A., Scourse, J.D. and Frank, D.C., 2009. Persistent positive North Atlantic Oscillation mode dominated the Medieval Climate Anomaly. Science, 324, 78-80 4. Ethiopian Climate Variability Ethiopia in the news Climatology (text book version) N Hemisphere winter N Hemisphere summer Addis Ababa Rainfall Back Trajectories May, E., Baker, A, Eden, J. and Asrat, A. Back trajectory and source region analysis of Addis Ababa rainfall. Int. J. Climatology, submitted The East African Monsoon Segele, Z.T., Lamb, P.J. and Leslie, L. M., 2009. Seasonal-to-interannual variability of Ethiopia / Horn of Africa monsoon Part I… Journal of Climate, 22, 3396-3421. Rainfall Variability 1948 - 2009 3 3 3 2 2 2 1 1 1 0 1940 1950 1960 1970 1980 1990 2000 2010 0 1940 1950 1960 1970 1980 1990 2000 2010 0 1940 1950 1960 1970 1980 1990 2000 2010 3 3 3 2 2 2 1 1 1 0 1940 1950 1960 1970 1980 1990 2000 2010 0 1940 1950 1960 1970 1980 1990 2000 2010 0 1940 1950 1960 1970 1980 1990 2000 2010 3 3 6 2 2 1 1 2 0 1940 1950 1960 1970 1980 1990 2000 2010 0 1940 1950 1960 1970 1980 1990 2000 2010 0 1940 1950 1960 1970 1980 1990 2000 2010 5 4 3 1 Data: 1948-2009; NCEP/NCAR reanalysis (3° x 3° grid, 33-42E, 3-12N) Ratio of Spring (April, May) to Summer (July, August) rainfall Rainfall Variability 1948 - 2009 5000 5000 5000 4000 4000 4000 3000 3000 3000 2000 2000 2000 1000 1000 1000 0 1940 1950 1960 1970 1980 1990 2000 2010 0 1940 1950 1960 1970 1980 1990 2000 2010 0 1940 1950 1960 1970 1980 1990 2000 2010 5000 5000 5000 4000 4000 4000 3000 3000 3000 2000 2000 2000 1000 1000 1000 0 1940 1950 1960 1970 1980 1990 2000 2010 0 1950 1960 1970 1980 1990 2000 2010 0 1940 1950 1960 1970 1980 1990 2000 2010 5000 5000 5000 4000 4000 4000 3000 3000 3000 2000 2000 2000 1000 1000 1000 0 1940 1950 1960 1970 1980 1990 2000 2010 0 1940 1950 1960 1970 1980 1990 2000 2010 0 1940 1950 1960 1970 1980 1990 2000 2010 Data: 1948-2008; NCEP/NCAR reanalysis Total annual rainfall Climatology and socio-economics Drought and subsequent famine in Ethiopia is due to ‘spring rains’ failure in the north and low and variable rainfall in the south. Poverty and subsistence farming is the cause of famine (GDP $700; 39% below poverty line). Irrigation was rare until recently, a large amount of the population is dependent on the success of the small rains for germination of the annual crop, as much as it is on the regularity of the big rains. Overpopulation is also an issue – rapid population growth (74 M people, growing at 2.23%, life expectancy 55 yrs). Plus global rising costs of food purchase. We need to understand how rainfall variability is related to large-scale climate processes. There is a periodicity in rainfall amount and seasonality – is it predictable and how will it change with anthropogenic global warming? Ethiopian Caves Eight years of field monitoring (1-3 trips per year, 5 caves): major element water hydrochemistry, rain and drip water stable isotopes, cave climate (data loggers) Cave exploration – several new caves Stalagmite sampling – almost all stalagmites contain continuous visible annual growth lamina. Asrat, A., Baker, A., Leng, M.J., Gunn, J. and Umer, M., 2008. Environmental monitoring in the Mechara caves, SE Ethiopia: implications for speleothem paleoclimate studies. Int. J. Speleo. 37, 207-220 Bero Caves Bero-1 Stalagmite Bero Cave, SE Ethiopia Sampled in 2005 and actively dripping. Continuous annual laminae Growth phases of ~100-600 yrs and long hiatuses Several U-Th and radiocarbon analyses ~Annual-biennial samples drilled for 18O. -1 0.0 -2.0 -4.0 -6.0 0 1.6 1.4 1.2 1.0 0.8 0.6 0.4 0.2 0.0 50 100 150 0.0 -2.0 -4.0 -6.0 4750 4850 4900 1.6 1.4 1.2 1.0 0.8 0.6 0.4 0.2 0.0 0.0 -2.0 -4.0 -6.0 4400 4450 4500 4550 0.0 -2.0 -4.0 -6.0 5300 5350 5400 5450 18 1.6 1.4 1.2 1.0 0.8 0.6 0.4 0.2 0.0 5800 4800 1.6 1.4 1.2 1.0 0.8 0.6 0.4 0.2 0.0 O Growth Rate (mm yr ) 1.6 1.4 1.2 1.0 0.8 0.6 0.4 0.2 0.0 0.0 -2.0 -4.0 -6.0 5850 5900 5950 6000 1.6 1.4 1.2 1.0 0.8 0.6 0.4 0.2 0.0 0.0 -2.0 -4.0 -6.0 7350 7400 7450 7500 7550 7600 7650 7700 7750 7800 Time (years BP) 18O (thick red line) and annual growth rate (thin line). Notice the clear decadal periodicity in the isotope record. What it is recording? Summer rains 1.6 1.4 1.2 1.0 0.8 0.6 0.4 0.2 0.0 -1 0.0 -2.0 -4.0 -6.0 0 1.6 1.4 1.2 1.0 0.8 0.6 0.4 0.2 0.0 50 100 150 0.0 -2.0 -4.0 -6.0 4750 4850 4900 1.6 1.4 1.2 1.0 0.8 0.6 0.4 0.2 0.0 0.0 -2.0 -4.0 -6.0 4400 4450 4500 4550 0.0 -2.0 -4.0 -6.0 5300 5350 5400 5450 18 1.6 1.4 1.2 1.0 0.8 0.6 0.4 0.2 0.0 5800 4800 1.6 1.4 1.2 1.0 0.8 0.6 0.4 0.2 0.0 O Growth Rate (mm yr ) Spring rains 0.0 -2.0 -4.0 -6.0 5850 5900 5950 6000 1.6 1.4 1.2 1.0 0.8 0.6 0.4 0.2 0.0 0.0 -2.0 -4.0 -6.0 7350 7400 7450 7500 7550 7600 7650 7700 7750 7800 Time (years BP) Oxygen isotope data very smooth and predictable. Suggests that the water has been stored for some time. Growth rate more ‘spikey’. Suggests that there is some sort of overflow taking place. Combine the two – the stalagmite is being fed by the bath overflow... We ran a hydrological model to understand the 18O record. Input data: isotope and climate data from Addis Ababa. Model: reservoir model with fracture flow bypass. Model ‘spun-up’ using rainfall 18O for 1986-1989. Output: scenarios for drip water 18O from 1990 – 2005. Baker, A., Asrat, A., Fairchild, I.J., Jex, C.N., Leng, M.J., Thomas, L., Widmann, M., Dong, B., van Calsteren, P., and Bryant, C. Decadal-scale Holocene rainfall variability recorded in an Ethiopian stalagmite. The Holocene, in review. Varying the model parameters confirms that the stalagmite is responding to rainfall amount and seasonality. Note the negative isotope shift in the 1997-99 spring rains failure -1 0.0 -2.0 -4.0 -6.0 0 1.6 1.4 1.2 1.0 0.8 0.6 0.4 0.2 0.0 50 100 150 0.0 -2.0 -4.0 -6.0 4750 4850 4900 1.6 1.4 1.2 1.0 0.8 0.6 0.4 0.2 0.0 0.0 -2.0 -4.0 -6.0 4400 4450 4500 4550 0.0 -2.0 -4.0 -6.0 5300 5350 5400 5450 18 1.6 1.4 1.2 1.0 0.8 0.6 0.4 0.2 0.0 5800 4800 1.6 1.4 1.2 1.0 0.8 0.6 0.4 0.2 0.0 O Growth Rate (mm yr ) 1.6 1.4 1.2 1.0 0.8 0.6 0.4 0.2 0.0 0.0 -2.0 -4.0 -6.0 5850 5900 5950 6000 1.6 1.4 1.2 1.0 0.8 0.6 0.4 0.2 0.0 0.0 -2.0 -4.0 -6.0 7350 7400 7450 7500 7550 7600 7650 7700 7750 7800 Time (years BP) Oxygen isotopes are recording decadal variations in total rainfall amount and seasonality. Six stalagmites and the last 10000 years from Ethiopia… 1 -42 0-2 0 -1 -5 -1 1-2 -3 18 o -2 -3 -6 -3 -4 0 -4 -7-5 -4 -5 -6 -6 -8 -1 -7-5 9100 300 9200 400 9300 500 9400 600 9500 700 9600 800 9700 900 9800 1000 9900 110010000 120010100 1300 7100 4400 7200 4500 7300 4600 7400 4700 7500 4800 7600 4900 7700 5000 7800 5100 7900 5200 8000 5300 8100 5400 -7 0 1000 2000 3000 4000 5000 6000 7000 8000 9000 10000 Years BP …a persistent decadal variability in rainfall seasonailty and amount Rainfall in Ethiopia: the future? Summer rainfall – Monsoonal component will be affected if there are changes in ocean sea surface temperature (due to changes in ocean circulation). Spring rainfall – analysis shows that modern spring rainfall amount correlates with Indian Ocean surface temperature Janicot, S., 2009. A Comparison of Indian and African monsoon variability at different time scales. Comptes Rendus Geoscience, 341, 575-590. Schott, F.A., Xie, S-P. and McCleary Jr, J.P., 2009. Indian Ocean circulation and variability. Rev. Geophys, RG000245 Biastoch, A., Boning, C.W., Schwarzkopf, F.U., Lutjeharms, J.R.E., 2009. Increase in Agulhas leakage due to poleward shift of Southern Hemisphere westerlies. Nature, 462, 495- Conclusions • Variability in Ethiopian rainfall amount and seasonality at a decadal timescale. This is persistent over the last millennia, and likely forced by sea surface temperature variations, which drive monsoonal rain. • Anthropogenic global warming has raised ocean sea surface temperatures including the Indian Ocean. At present, rainfall response to future climate scenarios is poorly captured by climate models due to complexity of Indian Ocean circulation and its ocean-atmosphere connectivity. With thanks to: All expedition and science team members, NERC, Royal Society, START, NIGL and OU-USF laboratories, and the people of Oromo, Ethiopia. Prof Mohammed Umer Dr Asfawossen Asrat Prof Ian Fairchild Prof John Gunn Dr Cath Jex Thank You! Summer rainfall: processes on an annual (top) and seasonal to multiannual timescale Segele, Z.T et al., 2009. J. Clim, 22, 3396- Useful links http://www.realclimate.org http://www.copenhagendiagnosis.org


