Geophone
advertisement
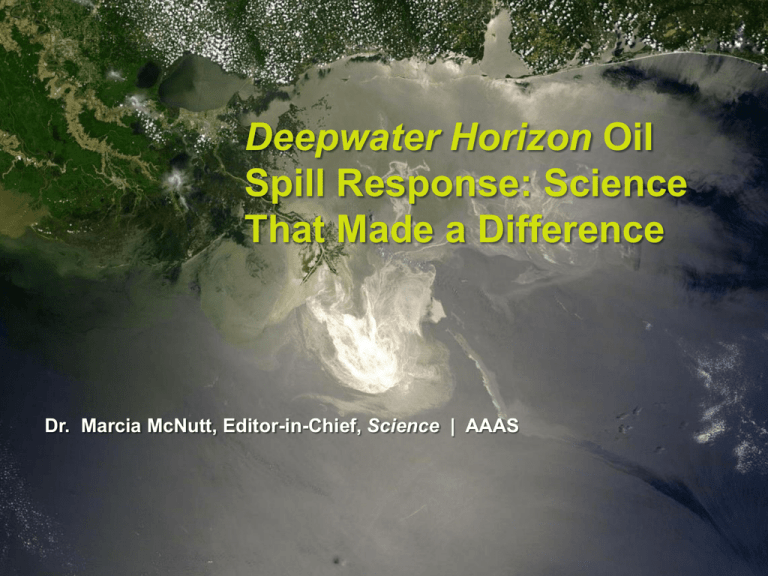
Deepwater Horizon Oil Spill Response: Science That Made a Difference Dr. Marcia McNutt, Editor-in-Chief, Science | AAAS Three Day Projected Oil Spill Movement Forecast – June 3 Sand Berms How useful? USGS Open-File Report 2010–1108 June 2, 2010 Effects of Building a Sand Barrier Berm to Mitigate the Effects of the Deepwater Horizon Oil Spill on Louisiana Marshes Estimating the Flow of the Macondo Well • Developing a sound estimate of the escaping oil was crucial for well intervention, oil containment, and operational response. • First estimate released was 5000 BPD, but it clearly needed revision by mid-May when the first video from the deep sea became available • No analogues to this event to use to choose the right method for measuring flow rate, so tried multiple methods • Type of Flow Rate Estimates Models Required no new data collection Used industry proprietary data Produced the greatest range in flow rates Could theoretically have been produced prior to blowout In-Situ Measurements at Wellhead Several methods produced timely and accurate rates Best approach for measuring total flow rate Measurements Displaced from Wellhead Very useful for gauging ratios of surface versus subsurface oil Video Analysis Analyzed video from ROVs Particle Image Velocimetry (PIV) © BP p.l.c Video Analysis 2nd analysis after riser cut © BP p.l.c Acoustic Method Imaging sonar plus ADCP deployed from ROV Collected fluid sample Imaging sonar ADCP Reservoir Modeling How does fluid flow through permeable rock in response to a pressure differential created by the well? Is the depletion scenario credible? Government Team Flow Estimates for 87 Days Riser falls to seabed ~62K BPD Riser cut ~4% increase LDEO 59.8K BPD NETL WHOI Hsieh Barrels of Oil per Day NETL UCSB LDEO DOE BKY PIV June 3 BKY PIV May 13-16 Stacking Cap installed ~4% decrease – 53K BPD Cumulative Release: ~4.9 million barrels Cumulative Oil Collected: ~0.8 million barrels (results from BP) Alex: A rare June hurricane that struck a glancing blow on June 25, 2010 Proposal to Shut In the Well Capping Stack (New) BOP (Deepwater Horizon) Relief Well #2 Relief Well #1 Source: Kent Wells technical briefing 8/2/10 (bp.com) Well Integrity Team Well Integrity Team members: (left to right): Paul Hsieh, Water Mooney, Marcia McNutt, Steve Hickman, Cathy Enomoto, Phil Nelson 48 hours Hours 24 hours 6 hours Pressure, psia 48 hours Hours 24 hours 6 hours Pressure, psia Well Kill Team BP schematic showing the well and relief well. MC 252 Monitoring Plan through Well Intercept Thurs Friday Tuesday 8/5 Operations: Monitoring 8/6 Saturday Sunday 8/7 8/8 Monday Tuesday Weds Thurs Friday Saturday Sunday Monday 8/9 8/10 8/11 8/12 8/13 8/14 8/15 8/16 8/17 Test Cement DDIII drilling & ranging Intercept Annulus Seismic: Nikola Post-Kill Seismic Seismic: contingent, only if HC observed in annulus Sonar: Bigelow/ Pisces Over wellhead with last seismic run, then every 48 hours or as SIMOPs permits Surface: Geophone: Surface monitoring for sheen Retrieve Geophone Data Geophone ROV: Pressure Pressure monitoring ongoing Temperature Discontinue Wellhead Temperature Monitoring P. Acoustics Discontinue Wellhead Hydrophone Monitoring (Big Ears) Wellhead Continue visual and sonar monitoring wellhead with intermittent seabed scans Retrieve & de-mob Geophone Bonnie: A tropical storm that was a direct hit on the Macondo well on July 24. Did Science Make a Difference? New science applications brought forth to estimate flow rate. Science was used to make a plausible case for well integrity at a time of conflicting evidence. Science was used to quantify bounds on well integrity as hurricanes and tropical storms bore down on the well site. The scientific method was used to settle all disagreements on the best way forward for well intervention to hasten the end to the Gulf crisis. Lessons Learned from the 1989 Exxon Valdez Oil Spill Think decades in terms of impacts and recovery Consider onshore/offshore and multiple levels of food chain as coupled ecosystem Natural variation in marine and coastal ecosystems will confound understanding of recovery Pre-spill data critical for assessing injury to resources and recovery Consider how clean is too clean?
