Transportation Performance Indicators, Greg Akin
advertisement
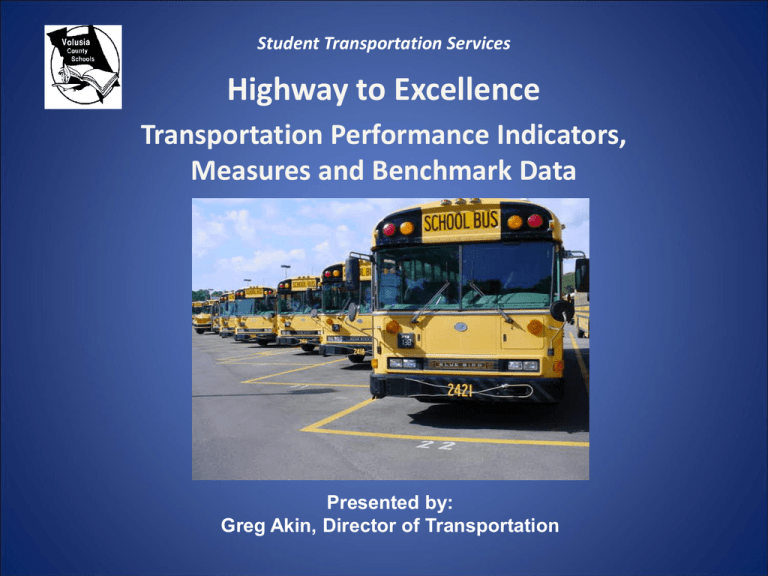
Student Transportation Services Highway to Excellence Transportation Performance Indicators, Measures and Benchmark Data Presented by: Greg Akin, Director of Transportation Agenda • Define Efficiency. • Where do we start? – Expenditures – Revenue • • • • Establish Performance Indicators. Things to think about. Cost savings measures. Bottom line 2 Define Efficiency • Webster defines efficiency as: – Acting effectively with a minimum of waste or effort. – Exhibiting a high ratio of output to input. 3 Where do we start? • Expenditures: what is the total cost (expenditures) to run your transportation department? – Salary including benefits, fuel, tires, parts, utilities, contracted services, overhead costs, everything. • Revenue: how much money (revenue) do you generate in a school year? – State FTE funds, Warranty claims, used oil, scrap metal, field trips, fuel sales tax refund, Outside program billings, auction equipment . 4 Where do we start? • Establish a common set of key performance indicators in a range of acceptable parameters. • Benchmark the key performance indicators • Document effective management practices • Record the performance data to improve resource deployment and decision making over time. • Develop standards of excellence for each of the indicators 5 Where do we start? • Gather your data: – – – – – – – – Total miles traveled (all buses) Total gallons of fuel dispensed (all buses) Total cost for fuel purchased Total cost of oil, tires and parts Total buses in fleet Total route buses in fleet Number of students transported Organizational chart – number of bus operators, bus attendants, mechanics and office staff 6 Establish Performance Indicators • What do you want to measure? • Operations: – Fully allocated costs – Percentage of district budget spent on transportation – Cost per student – Percentage of students riding the school bus – Cost to operate a school bus – Cost per mile traveled – Average Bus Occupancy – Managers span of control – Established bus stops – Cost of HSH – Cost of Summer School – Cost to transport Charter Schools 7 Establish Performance Indicators • Fleet: – – – – – – – – – – Spare Bus Ratio Average age of buses (Years/Miles) Average Maintenance and repair cost per vehicle Technician – vehicle ratio Annual parts consumption per vehicle Average parts inventory value Parts inventory turnover rate Span of control Number of breakdowns for the year Labor Costs 8 Cost per Student Calculation Analysis of the Data Factors That Influence This Measure • Wage and benefit structure and labor contracts • Cost of the fleet, including fleet replacement plan, facilities, insurance and maintenance • Effectiveness of the routing plan • Ability to use each bus for more than one run • Bell schedule • Maximum riding time allowed and earliest pickup time allowed • Contracted service costs • Types of transported programs served $571.50 - $698.50 Fiscal Year Measured Cost per Student District Cost per Student % of Increase Decrease FY 07 $689.00 $275.00 --- FY 08 $767.00 $348.00 + 10% FY 09 $664.00 $256.00 - 13.5% FY 10 $623.00 $240.00 - 6% 9 Students Receiving Basic Home to School to Home Bus Transportation Factors That Influence This Measure Analysis of the Data 40% – 50% Fiscal Year Total Students • % of students transported by policy and law • Placement of school attendance boundaries FY 08 63,418 and zones • Viable public transportation options FY 09 61,940 (Parent option) • Special programs FY 10 62,033 supported by transportation FY 11 61,316 Total Students Eligible % Eligible Total Students Riding Bus % Riding Bus of Total Eligible % Riding Bus against Total # Student 45,386 72% 24,552 54% 39% 42,685 69% 24,050 56% 39% 42,746 69% 24,321 56% 39% 43,338 71% 25,445 59% 41% 10 Cost per District-Operated Bus Factors That Influence this Measure • • • • • • Analysis of the Data $45 k – $50 K Fiscal Year Local cost of living factors Bargaining unit condition Types of programs supported; AYP, Plus-one, Academies and Cross FY 07 County transportation Geographical Location FY 08 Serviced Fuel Costs Deadhead miles FY 09 # of Route Buses Total Expenditures (7800 Report) Cost per District Operated Bus % of Increase or Decrease 269 $17,602,922 $65,438.37 -- 268 $18,838,178 $70,291.71 + 7% 235 $16,322,011 $69,752.18 - 1% FY 10 234 $15,508,754 $66,276.72 - 5% 11 Miles between Accidents Factors That Influence This Measure • Definition of accident and injury as defined by Support Services Policy 505 and statute • Preventative accident training programs • Experience of driving force Analysis of the Data 43 K – 74 K Fiscal Year Measured Miles between Accidents Percentage of Increase or Decrease FY 07 50,220.75 -- FY 08 44,301.31 - 12% FY 09 58,428.25 + 25% FY 10 64,094.58 + 9% 12 Total Miles per Bus Factors That Influence This Measure Analysis of the Data 18 K – 22 K Fiscal Year Measured Total Miles per Bus FY 08 19,268.60 FY 09 19,393.21 FY 10 19,173.59 FY 11 18,849.23 • Routing system • Types of transportation programs served • Size of service area • District-labor agreements • Location of bus terminals 13 Runs per Day Factors That Influence This Measure • • • • • • • • • District-managed transportation Tiered school bell times Bell schedule changes Bus capacities District guidelines on maximum ride time District geography Minimum/shortened/staff development day scheduling Effectiveness of the routing plan Types and location of transported programs served Analysis of the Data 4 to 6 Fiscal Year Measured Runs per Day per Bus FY 08 1377 divided by 268 = 5.13 FY 09 1202 divided by 235 = 5.11 FY 10 1200 divided by 234 = 5.13 FY 11 1266 divided by 234 = 5.41 14 Average Bus Occupancy (Number of Students per Bus) (ABO) Factors That Influence This Measure • Effectiveness of the routing plan • Ability to use each bus for more than one run each morning and each afternoon • Bell schedule • Type of programs served • Strategic procurement of buses leveraging seating capacity • District guidelines on maximum ride time • Parent transportation options Analysis of the Data .90% - 1.00% Fiscal Year Measured Average Bus Occupancy FY 08 .91% FY 09 103.22% FY 10 103.79% FY 11 103.56% 15 Students with IEP Transported on Dedicated Buses Factors That Influence This Measure Analysis of the Data 75% - 95% Fiscal Year Percentage of Dedicated Buses Total Number ESE Students (G & Y) • District-managed transportation • Availability of alternative modes of FY 08 1377/3.5 5,881 transportation /96.5% • Partnerships with public transportation agencies FY 09 1202/2.9 2,097 • District’s mainstreaming /97.1% and Least Restrictive FY 10 1200/2.4 1,551 Environment policies /97.6% FY 11 1266/ 970 Gifted Students Number of Students Dedicated Runs 381 392 48 399 216 36 528 129 29 1,140 113 28 16 Transportation Expenditures as Percent of General Fund Factors That Influence This Measure • Types of transported programs supported • District-run operation • Percent of students transported by policy and law • Percent transported by bus versus public transportation • Public transportation as a viable option • Labor costs in the district area • Efficient administration of program Analysis of the Data 4% - 5% Fiscal Year Measured Percentage of General Fund FY 07 3.6% FY 08 3.83% FY 09 3.29% FY 10 3.75% 17 Miles between Preventable Accidents Factors That Influence This Measure Analysis of the Data 89 K – 106 K Fiscal Year Measured Miles between Preventable Accidents Percentage of Increase or Decrease FY 07 307,232.82 -- FY 08 304,897.29 - 1% • Preventative accident training programs FY 09 506,378.22 + 40% • Experience of driving force FY 10 1,121,655 + 65% • Definition of accident and injury as defined by the survey vs. district definition • Definition of a preventable accident 18 Cost per Total Mile Operated Factors That Influence This Measure • Wage and benefit structure • Cost of the fleet, including fleet replacement plan, facilities, fuel, insurance and maintenance • Effectiveness of the routing plan • Ability to use each bus for more than one route or run • Bell schedule • Maximum riding time allowed and earliest pickup time allowed • Type of programs served will influence costs Analysis of the Data $4.50 - $5.50 Fiscal Year Measured Cost per Total Mile Traveled Percentage of Increase or Decrease FY 07 $3.37 -- FY 08 $3.63 + 7% FY 09 $3.88 + 6.5% FY 10 $3.45 - 10% 19 Route Utilization Efficiency: Tier Number Rt. Buses FY 09 – 235 Number Rt. Buses FY 10 – 234 Number Rt. Buses FY 11 - 234 Tier 1 3 (1%) 2 (.8%) 1 (.43%) Tier 2 68 (29%) 64 (27.35%) 45 (19.23%) Tier 3 148 (63%) 148 (63.25%) 168 (71.79%) Tier 4 16 (7%) 20 (8.55%) 20 (8.55%) Bus Stop Analysis FY 07 FY 08 FY 09 FY 10 FY 11 Total Number Bus Stops within the District 4, 667 3,895 2,541 2,493 2,451 Number of Bus Stops Not on a Main Roadway 4,261 3,511 2,194 2,152 2,107 Numder of Stops on Main Roadways 45 to 55 mph 313 287 250 244 255 Number of Stops on Main Roadways 55 to 65 mph 93 97 97 97 95 Number of Curbside Bus Stops 1,272 937 707 653 647 Number of Students at Each Stop On Average 14 10 12 13 11 21 Trend Analysis on Accidents Crash Type FY 07 FY 08 FY 09 FY 10 Backing 16 23 13 6 Moving Forward 42 40 31 32 Left Turn 14 14 9 6 Right Turn 9 14 7 7 Rear Ended (Stopped/Stopping) 13 16 12 15 Parked (Properly/not Properly) 5 1 3 0 Lane Change 1 1 2 0 3 Point Turn 0 1 0 0 Unknown 4 7 1 4 Total 104 117 78 70 22 FTE Comparison Chart School Year Number Eligible Students Transported Number Route Buses Average Bus Occupancy Estimated Funds Collected FY 05 26,032 263 92.59% $10,848,964.00 FY 06 26,956 263 97.46% $11,542,672.00 FY 07 27,039 271 94.51% $12,236,380.00 FY 08 25,744 268 90.93% $12,018,236.00 FY 09 24,680 235 106.00% $11,609,952.00 FY 10 24,287 234 103.79% $10,354,044.00 FY 11 25,445 234 103.56% $10,528,061.00 23 Mutual agreements • Shared tire and recap bid • Shared battery bid • Assisted in developing consortium for fuel bid • Negotiated discount for bio-diesel fuel • Mutual aid agreement with County of Volusia for fuel Authorized warranty repair center for several manufacturer’s • • • • • • • • Blue Bird buses International Engines & buses Thomas buses Cummins engines Carrier A/C TransAir A/C Ricon Wheel chair lifts Truck-lite lighting Performing warranty repairs in-house provides reimbursement for warranty parts and labor reimbursement as high as $75.00 per hour. 24 Things to think about • • • • • • • • Employee turnover rate: Recruitment /Retention Training costs Absenteeism rate Vehicle accidents tracking and trend analysis Student Behavior Management/referrals Projected growth or decline in ridership Collective Bargaining / Union Dialogue Timely and accurate Billing process 25 Things to think about • On-time delivery • Efficiency and Effectiveness – Per school – percentage of bus riders – Breakdown per bus the number of riders – Number of buses servicing the school – Cost to run the route • Annual bus stop review • Bus utilization / pairings (3-tier system) • Deadhead miles • Employee overtime reports • Bi-annual Compliance review of records • Vandalism on buses / Break-ins at facilities or buses 26 Cost saving measures • • • • • • • • • • • Consolidated bus stops Depot stops Bell times Bus route to attendant ratio Out of zone transportation Eliminate alternative bus stops Remove non-eligible bus riders Reduced idling policy Fully utilize buses in a three tier system No return to school procedure for unsafe behavior Reduce overtime 27 28 Bottom Line • Expenditures versus Revenue • Would you run the department any different if it was your checkbook? • Can you do the job any better? • Continue to monitor the operations and look for ways to improve the process • Make decisions based on your data! • Balancing Act: – Quality of Service (Customer Focus) – Political Pressure 29 Mission Statement: through partnerships and teamwork we will provide a cooperative, responsive and personal approach to ensure safe, secure, effective and efficient transportation to support instructional programs and services for students, families and the community. 30
