Presentation - 15th TRB National Transportation Planning
advertisement
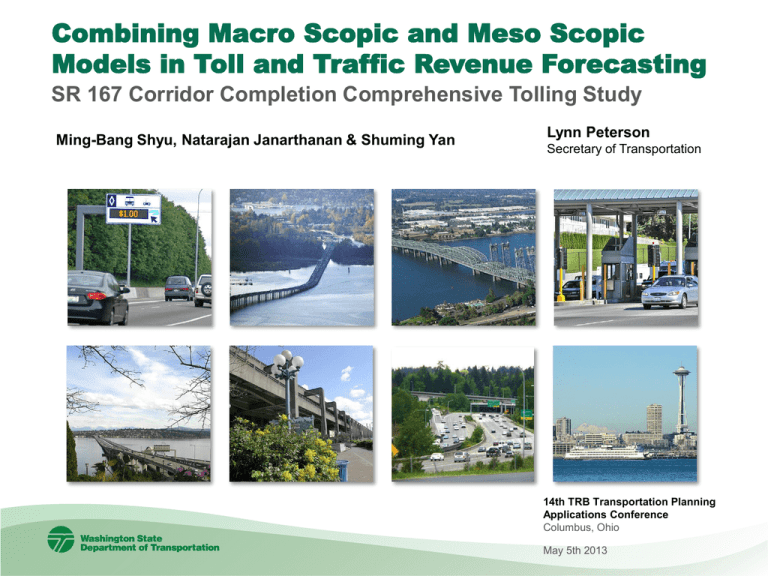
Combining Macro Scopic and Meso Scopic Models in Toll and Traffic Revenue Forecasting SR 167 Corridor Completion Comprehensive Tolling Study Ming-Bang Shyu, Natarajan Janarthanan & Shuming Yan Lynn Peterson Secretary of Transportation 14th TRB Transportation Planning Applications Conference Columbus, Ohio May 5th 2013 Project Background - Planning started over 40 year ago - EIS was completed in 2006 - FHWA signed ROD in 2007 - Fills a missing link - Adds connection to Port of Tacoma - Moves freight faster 2 The SR 167 Extension 3 SR 167 Extension: Current Status What we have accomplished so far Record of Decision on EIS granted Purchased 70% of needed right of way Tolling feasibility study completed Where we are now Comprehensive Tolling Study analyzing tolling options to close funding gap Identifying staging scenarios to decrease initial capital costs What we need to complete the project Funding for remaining right of way, design and construction ($1.5 B) Purchase remaining 30% of right of way (100 parcels = $165 M) Complete design, acquire permits, build project • Staging the project to reduce up front capital costs is highly likely 4 Different Types of Tolling Studies • Feasibility Study – Is there merit to toll the corridor and use the tolling revenue to help finance the project? • Comprehensive Study - How much revenue can be expected from tolling? What are the impacts? What does the public think about it? • Investment Grade Study – What will the interest rate be? What is the debt payment plan? What are the risks and mitigations? 5 Toll Study Process Concept of Operations • Toll rate structure • Cost to implement tolls Project Specifications • Project scope and cost • Expenditure cash flow Iterative Process Financial Modeling • Toll funding contribution to project • Matches timing of sources and uses Traffic Modeling • Maximize Revenue • Minimize Diversion Revenue Modeling • Annual gross toll revenue stream • O&M costs paid by tolls 6 SR 167 Comprehensive Tolling Study Analysis assumptions: • • • • • Toll rates are set for maximum revenue generation All vehicles except transit pay tolls Toll rates vary by time of day based on congestion levels Trucks pay higher tolls Toll financial capacity analysis was based on current market conditions 7 Phase 1 Conceptual Scope 8 Potential Trips Diversions Legend SR 167 Extension Potential Diversion Route 9 Traditional Macro Scopic Model Approach Social-Economic Data – Households and Employments Trip Generation Trip Distribution Mode split Trip Assignment 10 Model Resolution Macro Scopic Travel Demand Model o Static model; o Instantaneous travel time methodology o Regional wide analysis o Output: Demand volumes Meso Scopic Dynamic Traffic Assignment (DTA) Model o Time dependent DTA model o Experienced travel time methodology o Regional wide or corridor analysis o Output: Throughputs Micro Scopic Simulation Model o o o Individual vehicle simulation Intersection or corridor operation analysis Output: Throughputs 11 General Approaches for Model Validation/Calibration Macro Scopic Static Assignment Model Meso Scopic DTA Model Counts Counts Travel times / speeds /queues Validation Calibration Network measures (VMT, VHT etc) Network measures (VMT, VHT etc) Traveling paths Traveling paths Link/node properties Link/node/movement properties Turn penalties Driver behavior properties (response time, follow up time, gap acceptance) Intersection control properties Demand adjustment Demand adjustment 12 Why We used the Meso Scopic DTA Model • Flow-Density-Speed relationship; • Car-following and lane changing theories; • Detailed network; • Intersection delay taken into account; • System dynamic traffic profile; • Lane based simulation. More realistic traffic operation and assignment Better traffic forecast 13 Meso Scopic DTA Model Development Process Future Base Travel Demand Model 2030 PM Sub Area Network Data Collection • Intersection geometry • Traffic profile • Intersection controls Future DTA model with SR 167 Extension and the optimal toll rates Future Base Year DTA Model Future DTA model with SR 167 Extension – test different toll rates 14 Meso Scopic DTA Model Development – SR 167 Subarea Regional Macro Scopic Model SR 161 I-705 Subarea Macro Scopic Travel Demand Model 15 Meso Scopic DTA Model Development – SR 167 Subarea Subarea Meso Scopic DTA Model - Network Refinements realistic geometry coding - 58 Intersections signal plans and stop controls - Demand Loadings 11 modes; 24 time intervals each 16 Meso Scopic DTA Model Development – Network Refinement Meso Scopic DTA Model - Detailed geometry for every intersection / interchange were coded. Macro Scopic Model 17 Meso Scopic DTA Model Development – Intersection Control SR 161 SR 161 - In order to capture the intersection delay during the traffic assignment, 58 signalized and unsignalized intersections were coded in the subarea network. Meso Scopic DTA Model Macro Scopic Model 18 Meso Scopic DTA Model Development – Demand Loading Refinement - For traffic dynamic, existing traffic profile were considered. -11 modes total and 24 15-min matrices for each mode were generated. 14000 Meso Scopic DTA model loading 12000 Static Macro model loading Vehicles 10000 8000 6000 4000 2000 0 19 Toll rate, traffic and revenue relationship Traffic Volume Revenue Traffic Max revenue toll 0 Toll rate 20 Toll Rates Used in Model (AM Peak) Auto toll rates in AM peak period 6:00 – 9:00 AM (in 2010 $) Medium truck rates are 1.5 times of auto; Heavy truck rates are 2 times of auto. Macro 0.75 Meso 0.75 Macro 0.50 Meso 0.50 Macro 1.15 Meso 0.95 Macro 0.75 Macro 1.15 Meso 0.75 Meso 1.35 Macro 0.75 Meso 0.75 21 Toll Rates Used in Model (PM Peak) Auto toll rates in PM peak period 3:00 – 6:00 PM (in 2010 $) Medium truck rates are 1.5 times of auto; Heavy truck rates are 2 times of auto. Macro 0.55 Meso 0.55 Macro 1.00 Meso 1.00 Macro 0.90 Meso 0.90 Macro 1.50 Macro 0.90 Meso 1.10 Meso 0.90 Macro 1.50 Meso 1.90 22 Model Results – 2030 Volumes (AM Peak) AM Peak Period 6:00 – 9:00 AM Macro 630 Meso 2240 Macro 610 Meso 880 Macro 2860 Meso 2640 Macro 900 Macro 2230 Meso 1190 Meso 4200 Macro 790 Meso 1410 23 Model Results – 2030 Volumes (PM Peak) PM peak period 3:00 – 6:00 PM Macro 480 Meso 1710 Macro 1310 Meso 1030 Macro 1330 Meso 2090 Macro 2270 Macro 770 Meso 3050 Meso 1960 Macro 2060 Meso 4780 24 Key Findings from Meso Scopic Model • It was a valuable and informative exercise • Higher extension usage when intersection delays are considered o o • AM peak period volumes and revenue increase about 1/2 in meso scopic model PM peak period volumes and revenue increase about 2/3 in meso scopic model A possible bottleneck was revealed: SR 167 extension to NB I-5 in AM peak period 25 Study findings: • Among the six options studied, tolling is expected to generate the revenue to pay for the on-going facility maintenance, operations and toll collection costs, but would generate only limited funding for construction. • Tolling would help manage traffic demand and make a phased approach (or incremental project implementation) more viable from both a traffic operations and financial standpoint. • Without future improvements on I-5 to accommodate traffic growth, congestion on I-5 is expected to grow which in turn, would constrain SR 167 extension usage and negatively affect the toll revenue. 26 Thank you!! Contact Information: Ming-Bang Shyu Senior Traffic & Toll Modeler Urban Planning Office, WSDOT shyumb@wsdot.wa.gov 206-4641290 Shuming Yan Deputy Director Urban Planning Office, WSDOT YanS@wsdot.wa.gov 206-4641276 Natarajan Janarthanan Modeling Manger Urban Planning Office, WSDOT JanartN@wsdot.wa.gov 206-4641274 27

