Columbus Hilton Hotel - Greater Columbus Georgia Chamber of
advertisement
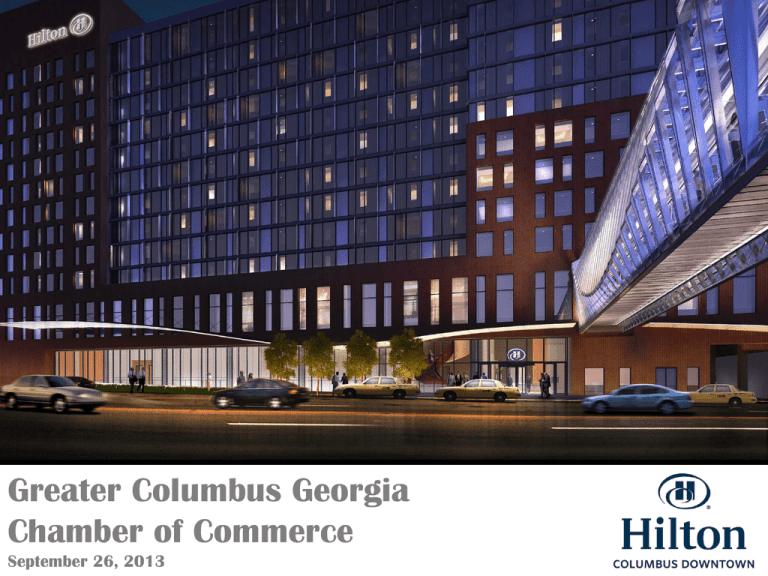
Greater Columbus Georgia Chamber of Commerce September 26, 2013 Franklin County Convention Facilities Authority • The FCCFA was created in 1988 to build the Greater Columbus Convention Center. • The FCCFA is a special government unit created under Chapter 351 of the Ohio Revised Code. • The FCCFA has an 11 member board appointed by the Franklin County Commissioners (6), City of Columbus (3) and Suburban Mayors (2). • The FCCFA was created to develop, build and operate convention facilities in Franklin County. The FCCFA has full governmental powers to levy a 4% countywide and additional .9% citywide hotel tax, set its own budgets, appropriate property and other duties outlined in ORC 351. • The FCCFA owns the Greater Columbus Convention Center, Nationwide Arena, the Columbus Hilton Downtown, land used to develop the Hyatt Regency and Drury Inn and Suites and various parking facilities. 2 Greater Columbus Convention Center • The Greater Columbus Convention Center (GCCC) was developed by a community urban redevelopment corporation (CURC) and opened in 1980 as a mixed use facility called the Ohio Center. The CURC became the operating company that managed the facility. • The Ohio Center consisted of 90,000 sf of arena/exhibit space, 50,000 sf of meeting space, an 18,000 sf ballroom and a retail mall. It was connected to the 631 room Hyatt Regency. • Almost as soon as it opened, the Ohio Center was too small to be an effective convention center and planning began for a new convention center. • The FCCFA opened the GCCC in March, 1993. It contained 216,000 sf of exhibit space, 50,000 sf of meeting space and a 25,000 sf ballroom. • In 1996, the FCCFA assumed ownership of the Ohio Center and through an RFP process hired SMG to manage the combined convention center. • The convention center was expanded in 2001 to add 125,000 sf of exhibit space, 15,000 sf of meeting space and a 15,000 sf ballroom. 3 Need for a Full Service Convention Hotel • The target market for Columbus conventions are groups with room blocks ranging from 1,000 to 3,500 that have met in our geographic region. • With the Hyatt Regency (631 rooms) as the HQ hotel, Columbus was able to meet the HQ hotel requirement for 65% of our target market. The addition of an additional 500 room HQ hotel enables us to meet the HQ hotel requirement of 92% of our target market. • At 426,000 sf of exhibit space, the Greater Columbus Convention Center can accommodate approximately 98% of our target market. • Based on market surveys, a new 500 room HQ hotel increased the propensity of customers to meet in Columbus by 170% 4 Columbus Hotel Pre-Development Timeline Feasibility/ Demand Study (confirmation of previous study) completed; recommended potential expansion of Hyatt as alternative Feasibility/ Demand Study completed Determined Hyatt expansion too difficult Mayor decided to explore public financing due to expense of using private development Elected officials briefed on potential public financing plans 2010 City, County, CFA announce agreement to finance project 2009 County endorses project 2008 Market/Financial Feasibility Study completed by SAG 2007 Financial Feasibility Study completed 2005 2004 2003 Feasibility/ Demand Study completed 2006 Feasibility/ Demand Study completed 2002 2001 Experience Columbus began lobbying for more hotel rooms Subcommittees formed to understand financing, marketing, economic impact and connectivity City, County, CFA agree to financing terms 5 Conditions Driving HQ Hotel Public Participation The last convention hotel to be financed without public support (other than in Las Vegas or Orlando) was the Chicago Sheraton in 1992 6 Impact on Convention Center Generated Room Nights Change in Convention Center Generated Room Nights Three years after Hotel Opened 80% 70% 60% 50% 40% 70% 50% 43% 42% 40% 30% 20% 10% 32% 25% 20% 20% 18% 18% 6% 0% Source: Local convention and visitor bureaus. 7 Impact on Competitive Hotels Supply/Demand Increase 60% Supply Demand Yr 1 50% Demand Yr 2 Demand Yr 3 21% 40% 9% Demand Yr 4 Demand Yr 5 30% 55% 48% 43% 20% 0% 7% 45% 32% 10% 7% 50% 26% 20% 7% 25% 23% Denver 2005 Houston 2004 Hyatt 1,100 Hilton 1,203 Source: Smith Travel Research. 3% 2% 40% 35% Louisville Charlotte 2005 2003 Marriott 616 Westin 700 Austin 2003 Hilton 800 26% 20% Indianapolis St. Louis 2011 2003 JW Marriott Renaissance 1,005 917 17%11% 3% San Diego 2008 Hilton 1,190 3% 12% 22% 7% 17% 6% 7% Baltimore San Antonio 2008 2008 Hilton 757 Grand Hyatt 1,003 Opened in Recession 8 Typical Problem Private Finance Approach – Prototypical 700 Rooms $250m $236m $200m Land Allowance $14 500 Parking Spaces $12m Meeting Space $52m Financing Gap $50m Donate Land Self Supporting Parking $150m $100m Rooms $158m Private $160m $140@75% $16m NOI 10% Yield $50m $0m Development Cost Warranted Investment 9 Convention Hotel Financing Models PRIVATE FINANCING With Public Incentives Pittsburgh Norfolk Philadelphia Denver 1991 1992 1995 1998 Miami Nashville Tampa Baltimore Jacksonville North Charleston Seattle Charlotte Richardson St. Louis San Jose 1999 2000 Providence Chicago 2001 Pittsburgh Airport Sacramento 2002 Overland Park Trenton 2003 Cambridge MD Myrtle Beach Austin Houston Omaha Schaumburg Denver Phoenix 2004 Shreveport Winston-Salem Raleigh 2005 2006 San Antonio La Vista 2008 Lancaster Ft Worth Manhattan KS Indianapolis Nashville Washington DC Austin Houston Miami Beach* 2009 2011 2012 2013 2014 2015 2016 2018 PUBLIC FINANCING San Juan Baltimore Dallas Columbus OH * No public incentives. 10 Public Private Partnerships • Nationwide Realty Investors developed the office buildings immediately south of the hotel site and brought 9,000 jobs downtown. • The FCCFA expanded the garage next to the hotel by 900 spaces to provide daily parking for these new workers. • The revenue received from these daily parkers covers approximately 85% of the debt service on the bonds. • Hilton International provided $3 million in upfront cash to help develop the Hilton Columbus Downtown. • The current convention center accounts for approximately 208,000 room nights annually for an economic impact of $140 million. With the new hotel this impact is expected to increase by at least 52,000 room nights worth $35 million in economic activity. • The convention center accounts for 2,100 jobs, $44 million in wages and $9.2 million in tax collections annually. With the new hotel, we expect 550 new jobs, $11 million in wages and $2.3 million in new tax collections. 11 Public Approach Case Study: Columbus • Opened fall 2012 • 532 Rooms; 22,000 sf meeting space • $142.8m project cost; $268,400/key • Plus Land Contribution • Hotel guests park in a CFA garage and pay market rates • $178m w/ issuance & reserves • $160m bond sale • $15m Authority equity • $3m Hilton “key money” contribution • 10% hotel occupancy tax rebated forever • No property tax – public ownership • $17.8m in Reserves (working capital, operating, rental, debt service) • Other Financing Pledges • Authority hotel land lease revenues from two other hotels • Equal amount of City Parking Meter Revenues • County Full Faith and Credit 12 5.0% 2.5% 0.0% Goal -2.5% -5.0% Dept. Profits G&A Expense $3m $20m $7m $12m $6m $10m Actual Budget PY Actual PY $0m $16m Sales & Mkting Expense $12m $30.00 $20.00 $10m $8m Goal $0.00 $0m $4m $2m $2m $1m $0m $2m $1m $0m Actual Budget Actual Budget PY $0m PY Actual Budget PY Actual PY Actual Budget PY -$5.00 $3m *Gross D/S prior to BABs subsidy Deposit Goal $0.00 $3m $6m Debt Service $5.00 Actual Other Expense $10.00 $2m Budget $6m $4m $8m $4m PY Actual PY RevPAR $5m $4m $3m $2m $1m $0m $10.00 $0m $14m Y E Cash Forecast $1m ADR $5m $8m BABs $18m $14m $10m Debt Service $2m $20m $15m NOI Deposited $25m Financial Dashboard Occupancy December 1 Pmt* Revenues June 1 Pmt* August 2013 August 2013 Occupancy Index (thru July 2013) Hilton Compared to Competitive Set 150% 125% 125% 100% 100% 75% Hilton Compared to Competitive Set 75% 50% (STAR data thru July 2013) STAR Report & SALT Dashboard 150% Revenue / Available Room Index (thru July 2013) 50% 25% Current Month YTD Running 3 Mo Running 12 Mo Average Daily Rate Index (thru July 2013) 150% Hilton Compared to Competitive Set 125% 100% 75% 50% 25% Current Month YTD Running 3 Mo Running 12 Mo 25% Current Month YTD Running 3 Mo Running 12 Mo Guest Satisfaction Scores (SALT) (thru August 2013) 100% 90% 80% 70% 60% 50% 40% 30% 20% 10% 0% --- Hilton Brand Benchmark Prop Loyalty Overall Experience Service Accomm. Arrival Departure % of respondents that rated hotel either 9 or 10 on a scale of 1 to 10 August 2013 Prospects by Year 70k 80k Hilton Columbus Dashboard Room Night Bookings By Year Room Night Pace 60k Over Goal Remaining to be Booked Tentative Booked 60k 70k 50k 40k 60k 50k 40k 30k 30k 20k 20k 50k 10k 10k 0k 0k 40k 2013 2014 2015 Definite Booking Types 30k 20k 10k 0k Tentative Booking Definite 2016 2017 Average Rate 100% 90% 80% City-Wide Goal/Budget to date Hilton bookings reflect contracts received and out for signature. In-House Group 2014 2015 Prospect by Type 135k 120k 105k 90k 75k 60k 45k 30k 15k 0k 110% 80k 70k 60k 50k 40k 30k 20k 10k 0k 2013 2018< 70% % of Goal 2016 2017 2018 Conv. Center Revenue Generated by Hilton $500k $400k Contracted through Yr End $300k $200k $100k Year to Date Actual $0k City-Wide In-House F&B + Rental Revenue August 2013 CVB Goal CVB Pace and Position 350k 275k 250k 2012 2013 300k 250k Room Nights 200k 175k Room Nights CVB Dashboard 225k 150k 125k 100k Definite room nights as of 9/3/2013 200k 150k 100k 75k 50k 50k 25k 0k 0k Goal Actual Current Year 1 Year Out 2 Years Out 3 Years Out 4 Years Out 5 Years Out Secrets to Success Build What You Can Afford Design the Hotel Through DD, THEN Retain the Brand • Agree upon a reasonable NOI projection • Back into development budget • Fight – Fight – Fight to keep it in budget • Brands some times want to better their image at your expense • Make approval of DD part of Brand selection Square Feet is Your Enemy • Think quality, but small rooms – conventions are short term stays • Study non-revenue support spaces diligently • Limit meeting space (a little) if hotel “laminated” to Center meeting spaces Get the Public Role Approved • Approve incentive package then seek development partner • Good developers with capital relationships won’t take approval risk • Avoid “other people’s money” developers Make the Right “Business” Decision • Make it about economics, keep politics out • Select someone you want to do business with • Consider a community led selection/recommendation 17 Questions 18


