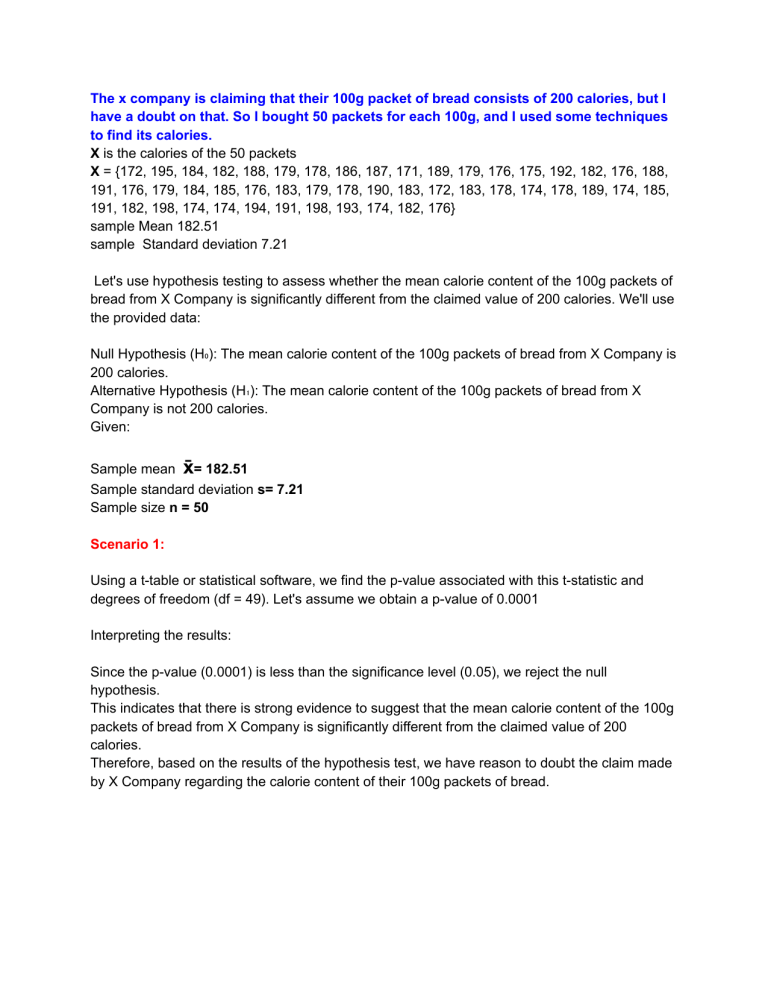
The x company is claiming that their 100g packet of bread consists of 200 calories, but I
have a doubt on that. So I bought 50 packets for each 100g, and I used some techniques
to find its calories.
X is the calories of the 50 packets
X = {172, 195, 184, 182, 188, 179, 178, 186, 187, 171, 189, 179, 176, 175, 192, 182, 176, 188,
191, 176, 179, 184, 185, 176, 183, 179, 178, 190, 183, 172, 183, 178, 174, 178, 189, 174, 185,
191, 182, 198, 174, 174, 194, 191, 198, 193, 174, 182, 176}
sample Mean 182.51
sample Standard deviation 7.21
Let's use hypothesis testing to assess whether the mean calorie content of the 100g packets of
bread from X Company is significantly different from the claimed value of 200 calories. We'll use
the provided data:
Null Hypothesis (H₀): The mean calorie content of the 100g packets of bread from X Company is
200 calories.
Alternative Hypothesis (H₁): The mean calorie content of the 100g packets of bread from X
Company is not 200 calories.
Given:
Sample mean x̄= 182.51
Sample standard deviation s= 7.21
Sample size n = 50
Scenario 1:
Using a t-table or statistical software, we find the p-value associated with this t-statistic and
degrees of freedom (df = 49). Let's assume we obtain a p-value of 0.0001
Interpreting the results:
Since the p-value (0.0001) is less than the significance level (0.05), we reject the null
hypothesis.
This indicates that there is strong evidence to suggest that the mean calorie content of the 100g
packets of bread from X Company is significantly different from the claimed value of 200
calories.
Therefore, based on the results of the hypothesis test, we have reason to doubt the claim made
by X Company regarding the calorie content of their 100g packets of bread.
Scenario 2:
What if the p value here is 0.30?
If the p-value in this scenario is 0.30, it would indicate the following:
- The p-value of 0.30 suggests that if the null hypothesis were true (i.e., if the mean
calorie content of the 100g packets of bread from X Company were actually 200
calories), we would expect to see the observed sample mean (182.51 calories) or a
more extreme result about 30% of the time due to random variability.(In simple terms
there is a 30% possibility to see less than company claim calories due to the random
chances.)
- With a p-value of 0.30, we would fail to reject the null hypothesis at a significance level
of 0.05. This means that we do not have sufficient evidence to conclude that the mean
calorie content of the 100g packets of bread from X Company is significantly different
from the claimed value of 200 calories.
- In simpler terms, a p-value of 0.30 suggests that the observed sample mean is not
particularly unusual or unexpected under the assumption that the null hypothesis is
true. Therefore, we do not have enough evidence to doubt the claim made by X
Company regarding the calorie content of their 100g packets of bread.
In summary, a p-value of 0.30 indicates that there is insufficient evidence to reject the
null hypothesis, and we would conclude that the mean calorie content of the 100g
packets of bread from X Company is likely close to the claimed value of 200 calories.
Scenario 3:
Other exampleIf p value is 0.04 means 4%, there is only 4% chances to get the calories
below the claim value due to random chances, so the statement they claim is false
For easy understanding:
- Possibility of Changes due to Random Chance: The p-value quantifies the likelihood of
observing the obtained results (or more extreme results) purely by random chance
under the assumption that the null hypothesis (H₀) is true.
- High Random Chance: If the p-value is high, it indicates that the observed results are
likely to occur by random chance alone. In this scenario, there may not be any
underlying reasons or effects causing the observed outcome. Therefore, we can accept
the null hypothesis (H₀) because the observed differences are likely due to random
variability.
- Low Random Chance: Conversely, if the p-value is low, it suggests that the observed
results are unlikely to occur by random chance alone. In other words, the probability of
observing the data under the null hypothesis is low, indicating that there may be other
factors influencing the observed outcome. In this case, we reject the null hypothesis
(H₀) because the observed differences are unlikely to be solely attributed to random
variability.
In summary:
- High P-value: We accept the null hypothesis (H₀) because the observed differences
are likely due to random chance alone.
- Low P-value: We reject the null hypothesis (H₀) because the observed differences are
unlikely to be explained solely by random chance, suggesting the presence of other
factors or effects.


