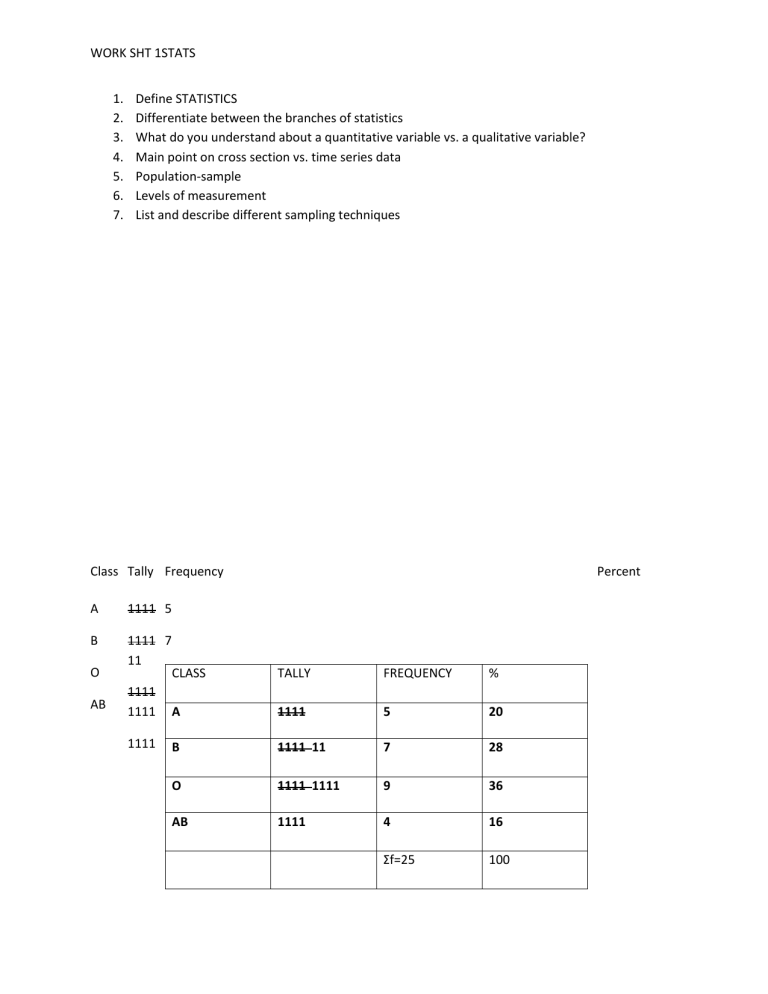
WORK SHT 1STATS 1. 2. 3. 4. 5. 6. 7. Define STATISTICS Differentiate between the branches of statistics What do you understand about a quantitative variable vs. a qualitative variable? Main point on cross section vs. time series data Population-sample Levels of measurement List and describe different sampling techniques Class Tally Frequency A 1111 5 B 1111 7 11 O AB Percent CLASS TALLY FREQUENCY % 1111 1111 A 1111 5 20 1111 B 1111 11 7 28 O 1111 1111 9 36 AB 1111 4 16 Ʃf=25 100 WORK SHT 1STATS Grouped data These are used when range of data is large • Class limits have the same value as the data, eg, 60 - 62 • Class Boundaries are not rounded numbers: • Rule of thumb to find the lower and upper boundary: • Lower limit - 0.5 = 60 - 0.5 = 59.5 = lower boundary • Upper limit + 0.5 = 62 + 0.5 = 62.5 = upper boundary • If you have been given, say, 7.8, then you need to subtract 0.05 for the lower boundary and add 0.05 for the upper. Class size/width= lower limit/boundary of a class – lower limit/boundary of preceding class. Class mark or mid point= (upper limit + lower limit)/2 Midpoint tells an average of how many elements or members fall within class. WORK SHT 1STATS Some rules 1. There should be 5-20 classes. 2. The class width should be an odd number. 3. The classes must be mutually exclusive. 4. The classes must be continuous. 5. The classes must be exhaustive. 6. The classes must be equal in width (except in open-ended distributions).
