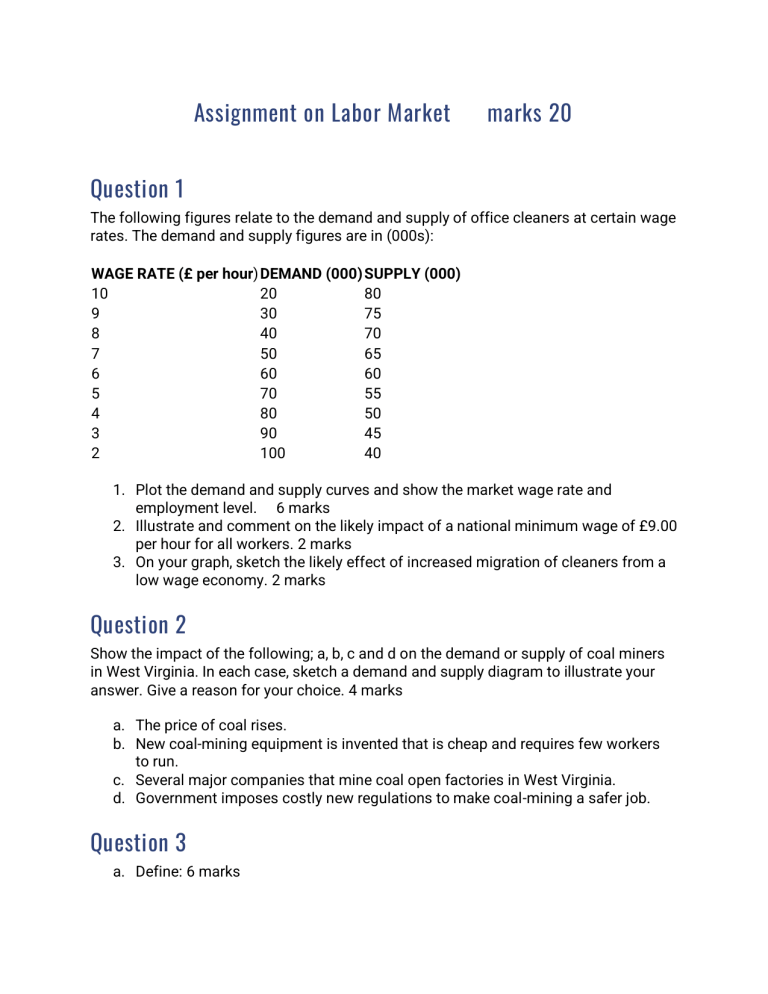
Assignment on Labor Market marks 20 Question 1 The following figures relate to the demand and supply of office cleaners at certain wage rates. The demand and supply figures are in (000s): WAGE RATE (£ per hour) DEMAND (000) SUPPLY (000) 10 20 80 9 30 75 8 40 70 7 50 65 6 60 60 5 70 55 4 80 50 3 90 45 2 100 40 1. Plot the demand and supply curves and show the market wage rate and employment level. 6 marks 2. Illustrate and comment on the likely impact of a national minimum wage of £9.00 per hour for all workers. 2 marks 3. On your graph, sketch the likely effect of increased migration of cleaners from a low wage economy. 2 marks Question 2 Show the impact of the following; a, b, c and d on the demand or supply of coal miners in West Virginia. In each case, sketch a demand and supply diagram to illustrate your answer. Give a reason for your choice. 4 marks a. The price of coal rises. b. New coal-mining equipment is invented that is cheap and requires few workers to run. c. Several major companies that mine coal open factories in West Virginia. d. Government imposes costly new regulations to make coal-mining a safer job. Question 3 a. Define: 6 marks Piece rate National minimum wage Commission


