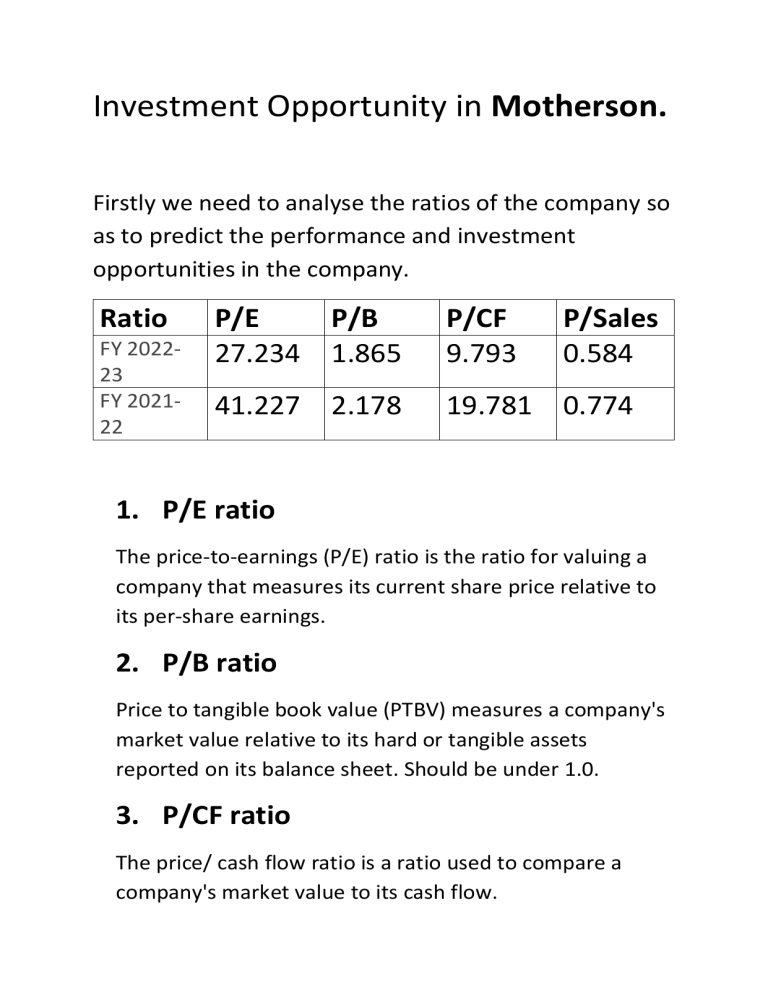
Investment Opportunity in Motherson. Firstly we need to analyse the ratios of the company so as to predict the performance and investment opportunities in the company. Ratio FY 202223 FY 202122 P/E P/B 27.234 1.865 P/CF 9.793 P/Sales 0.584 41.227 2.178 19.781 0.774 1. P/E ratio The price-to-earnings (P/E) ratio is the ratio for valuing a company that measures its current share price relative to its per-share earnings. 2. P/B ratio Price to tangible book value (PTBV) measures a company's market value relative to its hard or tangible assets reported on its balance sheet. Should be under 1.0. 3. P/CF ratio The price/ cash flow ratio is a ratio used to compare a company's market value to its cash flow. 4. P/SALES ratio It is calculated by dividing the company's market capitalization by the revenue in the most recent year; or, equivalently, divide the per-share stock price by the pershare revenue. As per the ratios compared to the previous year ratios, we can say that there is a market correction and all the ratios suggest that there is a good time to have a stake on this share. BUY Considering the impact of accounting for Composite Scheme of Amalgamation and Arrangement. (i) Ratios for the period ended March 31, 2022 have been calculated after considering relevant amounts pertaining only to continuing operations, hence the ratio is not strictly comparable. (ii) Debt service coverage ratio has decreased due to higher amount of long-term borrowing maturing in the next twelve months as compared to FY 2021-22. (iii) Return on Equity ratio has improved due to increased profit of the Group compared to FY 2021-22. (iv) Net Capital Turnover Ratio, has decreased due to higher revenue in FY 2022-23 and also due to increased current maturity of long-term borrowings impacting the working capital for the FY 2022-23. (v) Net Profit ratio has improved due to increase in profit for FY 2022-23 as compared to FY 2021-22. (vi) Return on Capital Employed has improved because of increase profit of the group as compared to FY 2021-22. (vii) Return on investment ratio has decreased because of Group’s share in losses of investment in entities accounted as per equity method during FY 2022-23. Analysis of Current Ratio, Stock and Receivables Current Ratio of Samvardhana Motherson International Ltd. with value of 0.973 indicates the company has insufficient current assets to pay off short-term debt obligations. The value of inventories has increased by Rs.13,811 million. There is an increase on account of carrying safety stock for customers due to supply chain issues and volatility in customer production schedules. This could be because the company is expecting higher demand for the products. Trade receivables (current assets) has increased by Rs.19404 million and trade receivables (non-current assets) has decreased by Rs.1272 million which means that some of the debtors have paid during the year. Accounts receivables is moving in line with sales as revenue from operations has also increased. The reasons for increase in accounts receivables could be because of increase in sales or a lenient credit policy. Analysis of Profitability Ratios: The Gross Profit Margin has been on the higher side, it means that the direct expenses related to manufacturing are well under control and that the firm is managing the stock of raw materials efficiently, although the GP margin has gone down by 0.4%, it can be attributed to inflation. The Net Profit margin is where things start going downhill. The firm has too little of a net profit, if compared to the revenue it generates. The firm has improved on its net profit margin wrt previous year. The


