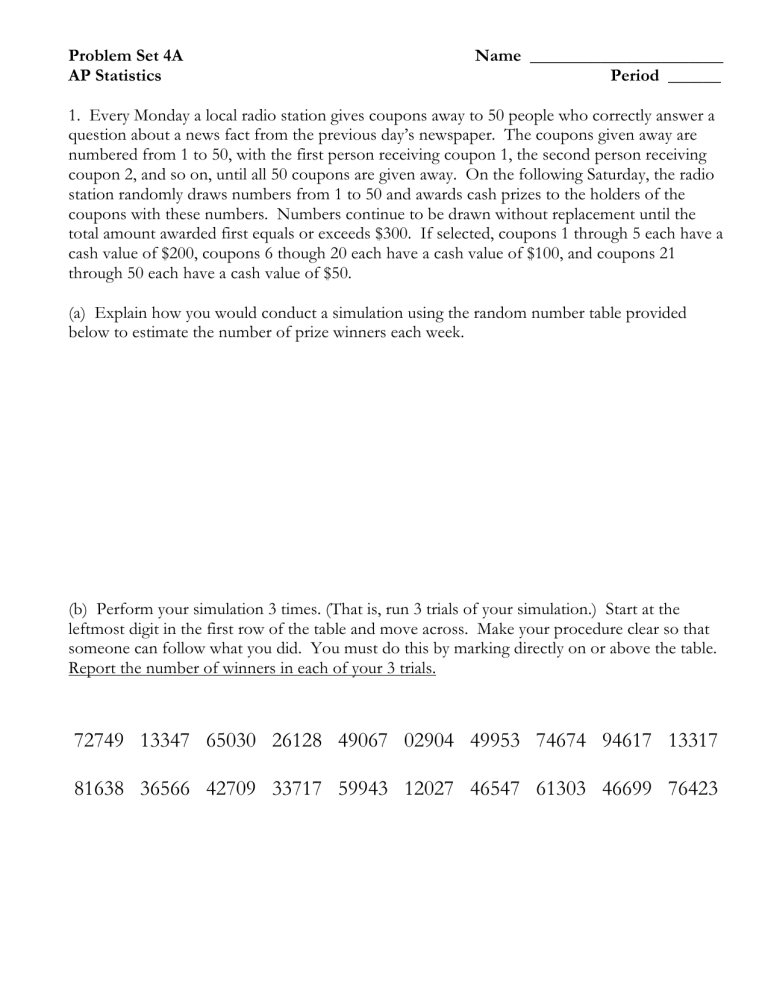
Problem Set 4A AP Statistics Name ______________________ Period ______ 1. Every Monday a local radio station gives coupons away to 50 people who correctly answer a question about a news fact from the previous day’s newspaper. The coupons given away are numbered from 1 to 50, with the first person receiving coupon 1, the second person receiving coupon 2, and so on, until all 50 coupons are given away. On the following Saturday, the radio station randomly draws numbers from 1 to 50 and awards cash prizes to the holders of the coupons with these numbers. Numbers continue to be drawn without replacement until the total amount awarded first equals or exceeds $300. If selected, coupons 1 through 5 each have a cash value of $200, coupons 6 though 20 each have a cash value of $100, and coupons 21 through 50 each have a cash value of $50. (a) Explain how you would conduct a simulation using the random number table provided below to estimate the number of prize winners each week. (b) Perform your simulation 3 times. (That is, run 3 trials of your simulation.) Start at the leftmost digit in the first row of the table and move across. Make your procedure clear so that someone can follow what you did. You must do this by marking directly on or above the table. Report the number of winners in each of your 3 trials. 72749 13347 65030 26128 49067 02904 49953 74674 94617 13317 81638 36566 42709 33717 59943 12027 46547 61303 46699 76423 2. A proud legislator claims that your state’s new law against talking on a cell phone while driving has reduced cell phone use to less than 12% of all drivers. While waiting for your bus the next morning, you notice that 4 of the 10 people who drive by are using their cell phones. Does this cast doubt on the legislator’s figure of 12%? Use a simulation to estimate the likelihood of seeing at least 4 of 10 randomly selected drivers talking on their cell phones if the actual rate of usage is 12%. Perform your simulation 10 times. Explain your conclusion clearly. 1. Component to be repeated – 2. Model outcomes – 3. Explain simulation – 4. Response variable – 5. Run the trials – 19770 91175 49511 69704 86138 81435 95560 14343 59840 86655 62459 31365 60106 19052 26485 28546 06012 75809 46034 19930 52092 13354 70806 09348 69077 24565 72637 92000 51209 47330 46843 62291 24472 80236 15086 76837 40642 66808 38940 53446 6. Analyze the response variable – 7. Conclusion – 3. Suppose Lisa has an 80% free throw success rate. How many shots might she make out of her next five attempts? Perform your simulation 10 times. 1. Component to be repeated – 2. Model outcomes – 3. Explain simulation – 4. Response variable – 5. Run the trials – 70318 73616 05321 79477 63314 28417 08553 15756 13064 86852 94408 00608 92337 64144 80906 96910 89788 70038 67658 94181 72440 58457 22885 76713 6. Analyze the response variable – 7. Conclusion – 4. Suppose Lisa has an 80% free throw success rate. What are her chances of making both of her next two attempts? Perform your simulation 10 times. 1. Component to be repeated – 2. Model outcomes – 3. Explain simulation – 4. Response variable – 5. Run the trials – 46361 38666 56455 61770 60381 27181 70602 01494 31315 95363 76772 97795 65305 81950 55821 38623 64248 36438 79333 49602 65489 90893 84941 28555 6. Analyze the response variable – 7. Conclusion –


