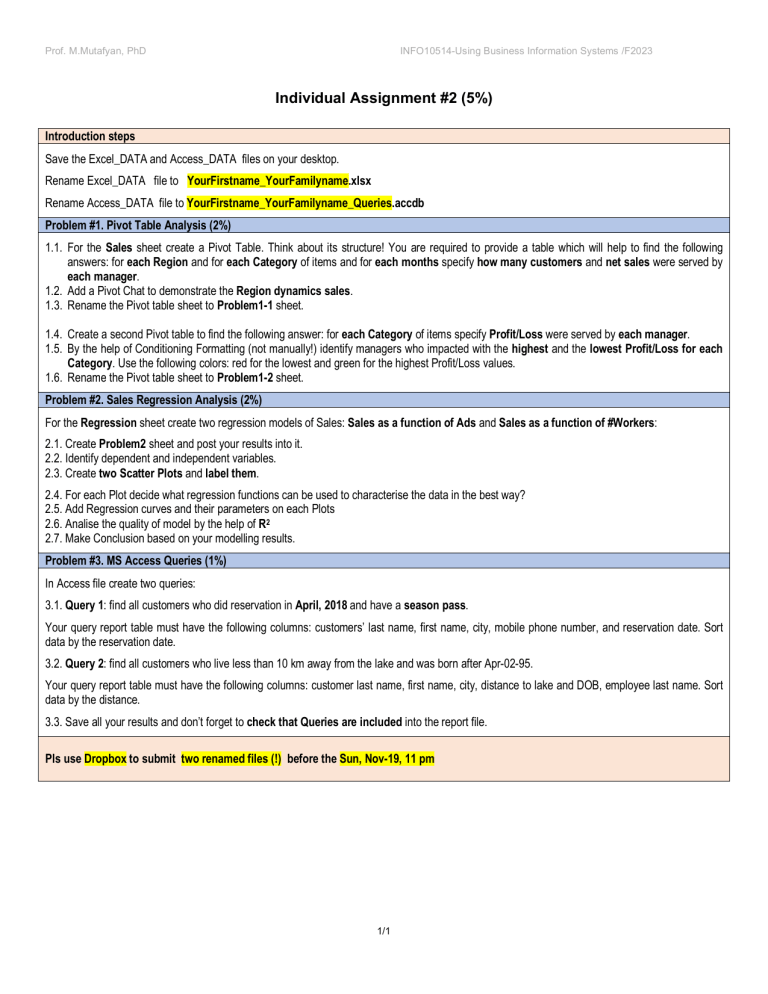
Prof. M.Mutafyan, PhD INFO10514-Using Business Information Systems /F2023 Individual Assignment #2 (5%) Introduction steps Save the Excel_DATA and Access_DATA files on your desktop. Rename Excel_DATA file to YourFirstname_YourFamilyname.xlsx Rename Access_DATA file to YourFirstname_YourFamilyname_Queries.accdb Problem #1. Pivot Table Analysis (2%) 1.1. For the Sales sheet create a Pivot Table. Think about its structure! You are required to provide a table which will help to find the following answers: for each Region and for each Category of items and for each months specify how many customers and net sales were served by each manager. 1.2. Add a Pivot Chat to demonstrate the Region dynamics sales. 1.3. Rename the Pivot table sheet to Problem1-1 sheet. 1.4. Create a second Pivot table to find the following answer: for each Category of items specify Profit/Loss were served by each manager. 1.5. By the help of Conditioning Formatting (not manually!) identify managers who impacted with the highest and the lowest Profit/Loss for each Category. Use the following colors: red for the lowest and green for the highest Profit/Loss values. 1.6. Rename the Pivot table sheet to Problem1-2 sheet. Problem #2. Sales Regression Analysis (2%) For the Regression sheet create two regression models of Sales: Sales as a function of Ads and Sales as a function of #Workers: 2.1. Create Problem2 sheet and post your results into it. 2.2. Identify dependent and independent variables. 2.3. Create two Scatter Plots and label them. 2.4. For each Plot decide what regression functions can be used to characterise the data in the best way? 2.5. Add Regression curves and their parameters on each Plots 2.6. Analise the quality of model by the help of R2 2.7. Make Conclusion based on your modelling results. Problem #3. MS Access Queries (1%) In Access file create two queries: 3.1. Query 1: find all customers who did reservation in April, 2018 and have a season pass. Your query report table must have the following columns: customers’ last name, first name, city, mobile phone number, and reservation date. Sort data by the reservation date. 3.2. Query 2: find all customers who live less than 10 km away from the lake and was born after Apr-02-95. Your query report table must have the following columns: customer last name, first name, city, distance to lake and DOB, employee last name. Sort data by the distance. 3.3. Save all your results and don’t forget to check that Queries are included into the report file. Pls use Dropbox to submit two renamed files (!) before the Sun, Nov-19, 11 pm 1/1
