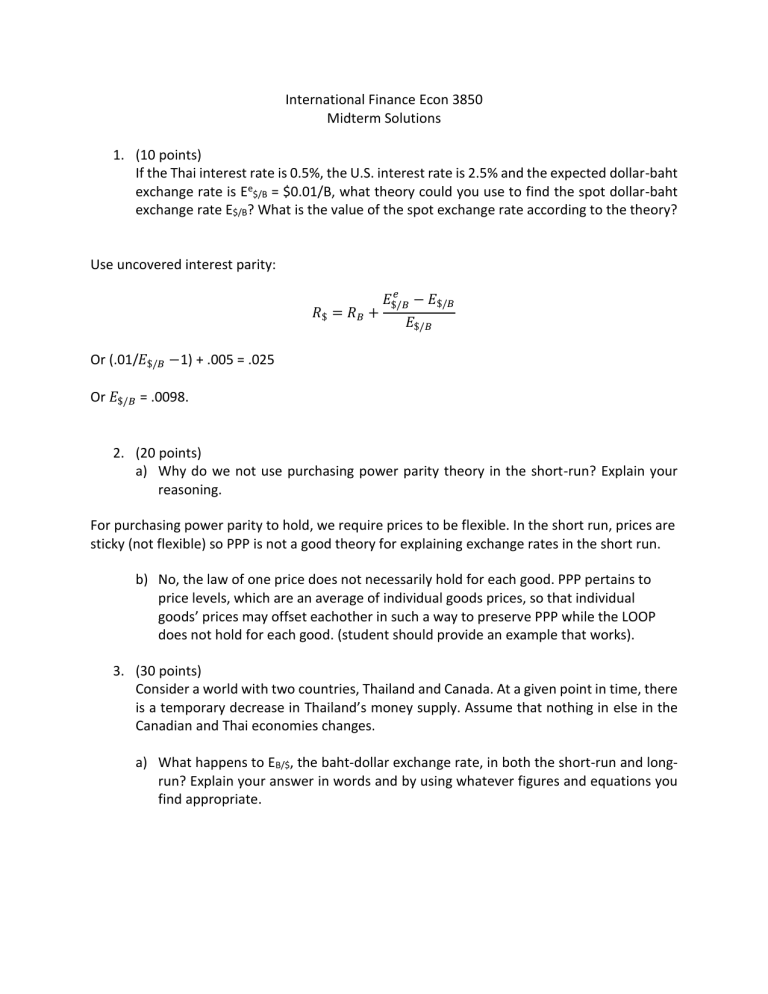
International Finance Econ 3850 Midterm Solutions 1. (10 points) If the Thai interest rate is 0.5%, the U.S. interest rate is 2.5% and the expected dollar-baht exchange rate is Ee$/B = $0.01/B, what theory could you use to find the spot dollar-baht exchange rate E$/B? What is the value of the spot exchange rate according to the theory? Use uncovered interest parity: 𝑅$ = 𝑅𝐵 + 𝑒 𝐸$/𝐵 − 𝐸$/𝐵 𝐸$/𝐵 Or (.01/𝐸$/𝐵 −1) + .005 = .025 Or 𝐸$/𝐵 = .0098. 2. (20 points) a) Why do we not use purchasing power parity theory in the short-run? Explain your reasoning. For purchasing power parity to hold, we require prices to be flexible. In the short run, prices are sticky (not flexible) so PPP is not a good theory for explaining exchange rates in the short run. b) No, the law of one price does not necessarily hold for each good. PPP pertains to price levels, which are an average of individual goods prices, so that individual goods’ prices may offset eachother in such a way to preserve PPP while the LOOP does not hold for each good. (student should provide an example that works). 3. (30 points) Consider a world with two countries, Thailand and Canada. At a given point in time, there is a temporary decrease in Thailand’s money supply. Assume that nothing in else in the Canadian and Thai economies changes. a) What happens to EB/$, the baht-dollar exchange rate, in both the short-run and longrun? Explain your answer in words and by using whatever figures and equations you find appropriate. In the short run, we assume that prices are not flexible, so the fall in the money supply would mean a fall in the real money supply. According to the graphs on the left hand side of the diagram, in the money market, this temporary decrease in Thailand’s money supply causes the real money supply (M/P) curve to shift from M/P 1 to M/P 2, shifting the equilibrium point from point 1 to point 2. As a result, Thailand’s interest rate increases from R1 to R2. In foreign exchange market, as the return on Thai baht deposits becomes higher than the return on Canadian dollar deposits, holders of the Canadian dollar deposit would sell them for Thai baht deposit instead. Therefore, the Baht return curve shifts to the right, shifting the equilibrium point from point 1’ to 2’ in the foreign exchange market. Moreover, the inflow of capital into Thailand causes the baht to appreciate against the dollar, which could be seen through a fall in the baht/dollar exchange rate from E1 to E2. In the long run, we assume that prices are flexible. According to the graphs on the right hand side of the diagram, because this is a “temporary” change in the money supply, the expected exchange rate in the long run does not change. Therefore, we would expect the real money supply to adjust back to its initial equilibrium level in the long run, moving back to point 1’ in the foreign exchange market and point 1 in the money market. This means there is no impact on both the interest rate and exchange rate in the long run. b) Is the short-run exchange rate, EB/$, above or below the expected long-run exchange rate? Explain the dynamics of the exchange rate over time with the help of a diagram. According to foreign exchange market model in the previous diagram, the short-run exchange rate would be below the expected long-run exchange rate because there is an appreciation of the Thai baht against the Canadian dollar. The diagram illustrating the exchange rate dynamics shows that the nominal exchange rate is initially at E1. At time t0, The temporary decrease in the real money supply caused a fall in the nominal exchange rate to E2 in the short run, which represents an appreciation of Thai baht against the Canadian dollar. However, because the shock is just ‘temporary’ it means that the real money supply will return back to its initial level as the shock disappears, making the nominal exchange rate to slowly increase back (depreciates) to its initial level at E1 in the long run. 4. (30 points) Consider a world with two countries, Thailand and Canada. At a given point in time, there is a permanent decrease in Thailand’s money supply. Assume that nothing else in the Canadian and Thai economies changes. a) What happens to EB/$, the baht-dollar exchange rate, in both the short-run and longrun? Explain your answer in words and by using whatever figures and equations you find appropriate. According to the graph on the left hand side of the diagram, in the short run, a permanent fall in Thailand’s money supply would shift the real money supply curve (M/P) leftward from M/P 1 to M/P 2 in the money market. This would then raise the rate of return for baht from R1 to R2. In the foreign exchange market, the increase in Thai’s interest rate shifts the rate of the rate curve from R1 to R2. More importantly, the permanent change means there is a change in the exchange rate expectations; therefore, as people expect the Thai to appreciate, this causes the expected Canadian dollar return to decrease. This represents a leftward shift of the “expected Canadian dollar return” curve, shifting the equilibrium point from point 1’ to point 2’. At point 2’, the nominal exchange has dropped from E1 to E2, which means there is an appreciation of the Thai baht against the Canadian dollar. According to the graph on the right hand side of the diagram, in the long run, the overall price level will fall in response to the fall in the money supply and output level. This causes the real money supply to steadily increase. The equilibrium will adjust back to the long run level from point 2’ to point 3’ in the foreign exchange market and from point 2 to point 3 in the money market. The real money supply and the interest rate remain unchanged, but the nominal exchange rate remains lower than its initial level at E3 (remained appreciated) even in the long run. b) Is the short-run exchange rate EB/$ above or below the expected long-run exchange rate? Explain the dynamics of the exchange rate over time with the help of a diagram. According to the foreign exchange market model in the previous diagram, the short-run exchange rate would be below the expected long-run exchange rate because there is an appreciation of the Baht against the Canadian dollar. The diagram illustrating the exchange rate dynamics shows that the nominal exchange rate is initially at E1. At time t0, the permanent decrease in the real money supply caused a fall in the nominal exchange rate to E2, which represents a large appreciation of Thai baht against the Canadian dollar. Then the exchange rate gradually depreciates to reach E3 in the long run. Therefore, it implies that the nominal exchange rate undershoots its long-run value when E2 is less then E3. 5. (10 points) A New Yorker travels to New Jersey to buy a $100 telephone answering machine. The New Jersey company that sells the machine then deposits the $100 check in its account at a New York bank. How would these transactions show up in the balance of payments accounts of New York and New Jersey? What if the New Yorker pays cash for the machine? The purchase of the answering machine is a current account debit for New York and a current account credit for New Jersey. When the New Jersey Company deposits the money in its New York bank, there is a financial account credit for New York and a corresponding debit for New Jersey. If the transaction is in cash, then the corresponding debit for New Jersey and credit for New York also show up in their financial accounts. New Jersey acquires dollar bills (an import of assets from New York and, therefore, a debit item in its financial account); New York loses the dollars (an export of dollar bills and, thus, a financial account credit).
