IE 375 – Production Planning
Homework Assignment 1 – October 10
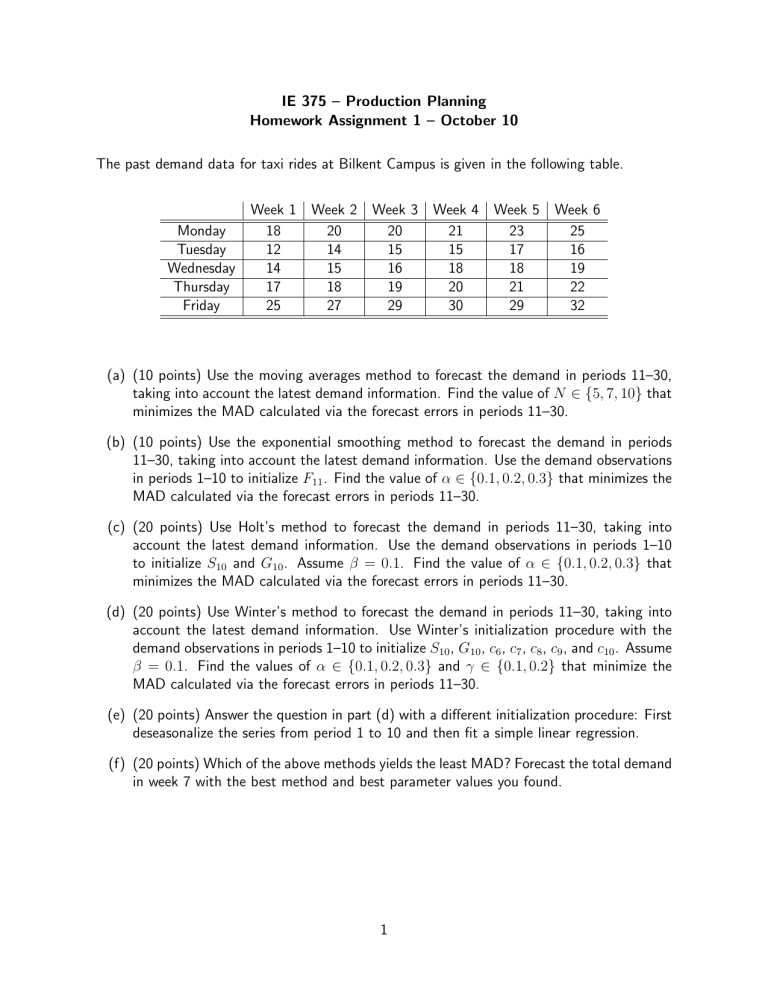
The past demand data for taxi rides at Bilkent Campus is given in the following table.
Week 1
Monday
18
Tuesday
12
Wednesday
14
Thursday
17
Friday
25
Week 2
20
14
15
18
27
Week 3
20
15
16
19
29
Week 4
21
15
18
20
30
Week 5
23
17
18
21
29
Week 6
25
16
19
22
32
(a) (10 points) Use the moving averages method to forecast the demand in periods 11–30,
taking into account the latest demand information. Find the value of N ∈ {5, 7, 10} that
minimizes the MAD calculated via the forecast errors in periods 11–30.
(b) (10 points) Use the exponential smoothing method to forecast the demand in periods
11–30, taking into account the latest demand information. Use the demand observations
in periods 1–10 to initialize F11 . Find the value of α ∈ {0.1, 0.2, 0.3} that minimizes the
MAD calculated via the forecast errors in periods 11–30.
(c) (20 points) Use Holt’s method to forecast the demand in periods 11–30, taking into
account the latest demand information. Use the demand observations in periods 1–10
to initialize S10 and G10 . Assume β = 0.1. Find the value of α ∈ {0.1, 0.2, 0.3} that
minimizes the MAD calculated via the forecast errors in periods 11–30.
(d) (20 points) Use Winter’s method to forecast the demand in periods 11–30, taking into
account the latest demand information. Use Winter’s initialization procedure with the
demand observations in periods 1–10 to initialize S10 , G10 , c6 , c7 , c8 , c9 , and c10 . Assume
β = 0.1. Find the values of α ∈ {0.1, 0.2, 0.3} and γ ∈ {0.1, 0.2} that minimize the
MAD calculated via the forecast errors in periods 11–30.
(e) (20 points) Answer the question in part (d) with a different initialization procedure: First
deseasonalize the series from period 1 to 10 and then fit a simple linear regression.
(f) (20 points) Which of the above methods yields the least MAD? Forecast the total demand
in week 7 with the best method and best parameter values you found.
1


