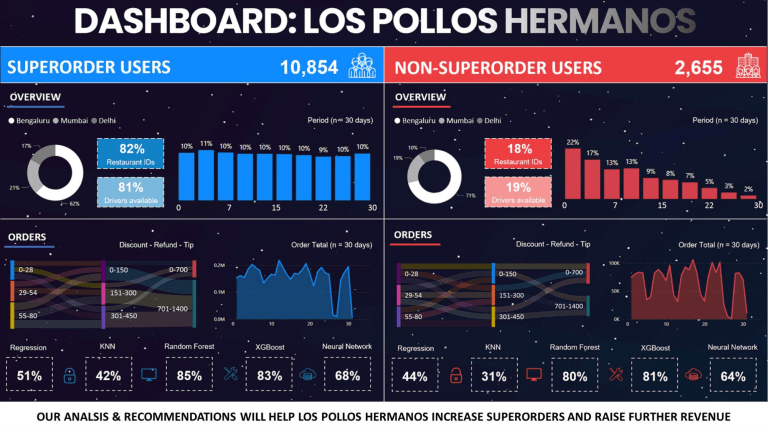
APPROACH FOR ANALYSIS OVERALL APPROACH OF THE ANALYSIS DATA-ANALYSIS ABOUT LOS POLLOS HERMANOS Source: dataset analysis 1 EXPLORATORY DATA ANALYSIS (EDA) INSIGHTS RECOMMENDATIONS 13K $68.7mn 10K $7K $519K Over 13K consumers in the company Total revenue generated from the order Super Orders made by consumers Amount refunded on the order placed by users Revenue generated from amount of tips Overview : OVERALL APPROACH DATA-Visualization: The dashboard created using Power BI was segregated in 2 sections – Super & Non-super Based on this visualization were made Modeling Click icon to access file Exploratory Data Analysis was done considering the most important variables from dataset • Predicting Probabilities – Built a classificatory model to predict the probabilities of customers ordering using Superorder feature • Conducted Interviews – We interviewed restaurant managers to understand parameters that help them segment & target users to support our insights INSIGHTS Machine Learning Models • Logistic regression, KNN, SVM, Random Forest, XGBoost Deep Learning Model • Neural Networks Model Loss & Accuracy • Model Accuracy • AUC-ROC • Classification Report Consumer Churn • Consumer Loyalty & Retention RFM Analysis • Customer Lifetime Values RECOMMENDATIONS • Forecast growth EDA • • Python & Excel Power Bi & Tableau • Click here to access all the files DATA-PREPROCESSING CONDUCTED DATA PRE-PROCESSING AND SPLIT TESTING TO GENERATE BETTER INSIGHTS 1 MAJOR STEPS INVOLVED Dropped statistically insignificant entries to conduct better analysis 2 BALANCING THE DATASET Balanced the dataset (SuperOrders) to perform the analysis on all variables Used Imblearn’s - Oversampling (RandomSampler) & Undersampling (N-v2)* Overall performance of model better for undersampled dataset as displayed Scaling numerical column decreases the spread & increases model efficiency UNDERSAMPLING & OVERSAMPLING TO BALANCE THE DATASET Data 0’s 1’s Total Imputed Data (Unbalanced) 3,605 695 4,300 Perform Label Encoding to convert ordinal data into Interval Oversampled Data 3,605 3,605 7,210 OLS logit regression to find statistically significant variables Undersampled Data 695 695 1,390 Variables with p-value < 5% are dropped from dataset Data complexity is reduced by decreasing no. of variables *condensed nearest neighbor, nearmiss v1, v2, v3 were tried & nearmiss v2 performed best EXPLORATORY DATA ANALYSIS VISUALIZING THE DATA AND HIGHLIGHTING THE STRIKING INSIGHTS 1 SUPERORDER ANALYSIS Chart displaying SuperOrders by Date Ordered 2 ORDERS FROM STATES Chord Chart revealing Delivery Region to Order Date 3 ORDER TOTAL ANALYSIS Tree Map revealing Order Total of Consumers MOST SUPERODERS WERE MADE IN THE MIDDEL OF THE MONTH MOST FREQUENT ORDERS MADE BY CONSUMERS IN BENGALURU HIGHEST ORDER MADE DURING MIDDLE OF THE MONTH BY CONSUMERS • An exploratory data analysis revealed that highest percentage of orders were SuperOrders during end of the month • To increase orders and generate more revenue company must grow in Mumbai & Delhi • The tree map above shows Order Total in accordance with the Date Order was made • High number of alternatives and good competition a probable reason for low reach in Delhi & Mumbai • Each branch reveals more revenue generated from SuperOrders & majority being SuperOrders in comparison to Non-SuperOrders • Company’s has high percentage of SuperOrders, far higher than the industry standards


