Matta Rice vs. Ponni Rice: Diabetes & Blood Glucose
advertisement

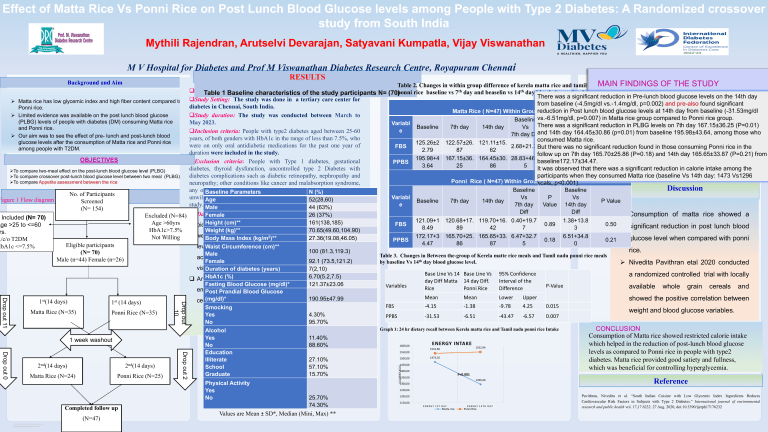
Effect of Matta Rice Vs Ponni Rice on Post Lunch Blood Glucose levels among People with Type 2 Diabetes: A Randomized crossover study from South India Mythili Rajendran, Arutselvi Devarajan, Satyavani Kumpatla, Vijay Viswanathan M V Hospital for Diabetes and Prof M Viswanathan Diabetes Research Centre, Royapuram Chennai RESULTS Background and Aim MAIN FINDINGS OF THE STUDY Table 2. Changes in within group difference of kerela matta rice and tamil nadu Study design: A Cross Over study Table 1 Baseline characteristics of the study participants N= (70)ponni rice baseline vs 7th day and beaselin vs 14th day blood glucose level There was a significant reduction in Pre-lunch blood glucose levels on the 14th day Study Setting: The study was done in a tertiary care center for from baseline (-4.5mg/dl vs.-1.4mg/dl, p=0.002) and pre-also found significant diabetes in Chennai, South India. in Post lunch blood glucose levels at 14th day from baseline (-31.53mg/dl Matta Rice ( N=47) Within Groupreduction difference Study duration: The study was conducted between March to p=0.007) in Matta rice group compared to Ponni rice group. Baseline vs.-6.51mg/dl, P May 2023. Variabl Baseline Vs There Baseline 7th day 14th day P Value in PLBG levels on 7th day 167.15±36.25 (P=0.01) Vs Valuwas a significant reduction e 14th day Diff Inclusion criteria: People with type2 diabetes aged between 25-60 7th day Diffand e14th day 164.45±30.86 (p=0.01) from baseline 195.98±43.64, among those who years, of both genders with HbA1c in the range of less than 7.5%, who consumed Matta rice. 125.26±2 122.57±26. 121.11±15. were on only oral antidiabetic medications for the past one year of FBS 2.68+21.36But0.39 0.16 there4.15+19.84 was no significant reduction found in those consuming Ponni rice in the 2.79 87 62 duration were included in the study. follow up on 7th day 165.70±25.86 (P=0.18) and 14th day 165.65±33.87 (P=0.21) from 195.98+4 167.15±36. 164.45±30. 28.83+46.0 <0.0 baseline172.17±34.47. Exclusion criteria: People with Type 1 diabetes, gestational PPBS 31.53+53.16 <0.01 3.64 25 86 5 1 It was observed that there was a significant reduction in calorie intake among the diabetes, thyroid dysfunction, uncontrolled type 2 Diabetes with participants when they consumed Matta rice (baseline Vs 14th day: 1473 Vs1296 diabetes complications such as diabetic retinopathy, nephropathy and Ponni Rice ( N=47) Within Groupkcals; difference p<0.001). neuropathy; other conditions like cancer and malabsorption syndrome, Discussion Baseline Baseline any other psychiatric illness and under weight loss management and Baseline Parameters N (%) Variabl Vs P Vs unwilling excluded from the Ageto sign the informed consent form were 52(28,60) Baseline 7th day 14th day P Value e 7th day Value 14th day study. Male 44 (63%) Matta rice has low glycemic index and high fiber content compared to Ponni rice. Limited evidence was available on the post lunch blood glucose (PLBG) levels of people with diabetes (DM) consuming Matta rice and Ponni rice. Our aim was to see the effect of pre- lunch and post-lunch blood glucose levels after the consumption of Matta rice and Ponni rice among people with T2DM. OBJECTIVES To compare two-meal effect on the post-lunch blood glucose level (PLBG) To compare crossover post-lunch blood glucose level between two meal (PLBG) To compare Appetite assessment between the rice Included (N= 70) Age >25 to <=60 rs. K/c/o T2DM HbA1c <=7.5% Collection: At baseline, anthropometric measurements, Female 26 (37%) Excluded (N=84) Data Height (cm)** 161(138,185) Age >60yrs biochemical profile, blood pressure and 24 hr dietary recall HbA1c>7.5% Weight (kg)** 70.65(49.60,104.90) were recorded. Pre (kg/m and post-lunch capillary blood glucose 2)** Not Willing Body Mass Index 27.36(19.08,46.05) Eligible participants (N= 70) Male (n=44) Female (n=26) 1st Matta Rice (N=35) (14 days) Ponni Rice (N=35) 1 week washout 2nd(14 days) Matta Rice (N=24) Ponni Rice (N=25) Drop out 2 Drop out 0 2nd(14 days) 100 (81.3,119.3) Male acceptability of Matta rice was evaluated using a satiety Female 92.1 (73.5,121.2) visual analogofscale. Duration diabetes (years) 7(2,10) (%)diet plan was advised to all the 6.70(5.2,7.5) An HbA1c individual participants and Fasting Blood Glucose (mg/dl)* 121.37±23.06 emphasized on the mealGlucose plate with a balanced distribution of Post Prandial Blood (mg/dl)* 190.95±47.99 cereals, pulses and vegetables. Smocking Yes No Alcohol Yes No Education Illiterate School Graduate Physical Activity Yes No Completed follow up (N=47) RESEARCH POSTER PRESENTATION TEMPLATE © 2019 www.PosterPresentations.com FBS PPBS levels were collected at 7th and 14th days of follow-up. The Waist Circumference (cm)** Drop out 10 Drop out 11 1st(14 days) Diff 4.30% 95.70% 121.09+1 8.49 172.17+3 4.47 120.68+17. 119.70+16. 0.40+19.7 89 42 7 165.70+25. 165.65+33. 6.47+32.7 86 87 5 Diff 0.89 0.18 Base Line Vs 14 Base Line Vs day Diff Matta 14 day Diff. Rice Ponni Rice 95% Confidence Interval of the Difference Mean Mean Lower Upper FBS -4.15 -1.38 -9.78 4.25 0.015 PPBS -31.53 -6.51 -43.47 -6.57 0.007 Variables 1600,00 ENERGY INTAKE 1541,66 1552,94 1550,00 27.10% 57.10% 15.70% 1.38+13.8 3 6.51+34.8 0 0.50 significant reduction in post lunch blood 0.21 glucose level when compared with ponni 1500,00 1473,10 1450,00 1400,00 rice. Nivedita Pavithran etal 2020 conducted a randomized controlled trial with locally P-Value available whole grain cereals and showed the positive correlation between Graph 1: 24 hr dietary recall between Kerela matta rice and Tamil nadu ponni rice Intake 11.40% 88.60% Consumption of matta rice showed a Table 3. Changes in Between the-group of Kerela matte rice meals and Tamil nadu ponni rice meals by baseline Vs 14th day blood glucose level. CALORIES KCLS Figure 1 Flow diagram No. of Participants Materials and Methods Screened (N= 154) weight and blood glucose variables. CONCLUSION Consumption of Matta rice showed restricted calorie intake which helped in the reduction of post-lunch blood glucose levels as compared to Ponni rice in people with type2 diabetes. Matta rice provided good satiety and fullness, which was beneficial for controlling hyperglycemia. P<0.001 1350,00 1296,66 1300,00 Reference 1250,00 25.70% 74.30% Values are Mean ± SD*, Median (Mini, Max) ** 1200,00 1150,00 ENERGY 1ST DAY Matta rice ENERGY 14TH DAY Ponni Rice Pavithran, Nivedita et al. “South Indian Cuisine with Low Glycemic Index Ingredients Reduces Cardiovascular Risk Factors in Subjects with Type 2 Diabetes.” International journal of environmental research and public health vol. 17,17 6232. 27 Aug. 2020, doi:10.3390/ijerph17176232

