Uploaded by
Margarida Barros de Oliveira
1951 USAF Resolution Test Chart: Optics & Imaging
advertisement

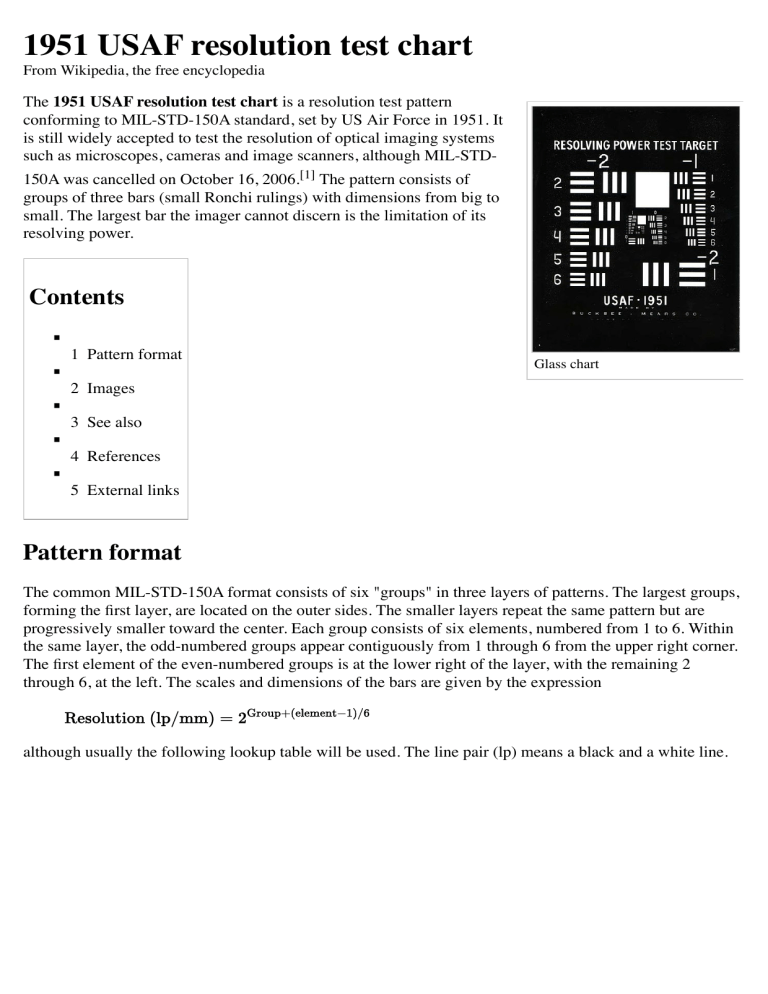
1951 USAF resolution test chart From Wikipedia, the free encyclopedia The 1951 USAF resolution test chart is a resolution test pattern conforming to MIL-STD-150A standard, set by US Air Force in 1951. It is still widely accepted to test the resolution of optical imaging systems such as microscopes, cameras and image scanners, although MIL-STD150A was cancelled on October 16, 2006.[1] The pattern consists of groups of three bars (small Ronchi rulings) with dimensions from big to small. The largest bar the imager cannot discern is the limitation of its resolving power. Contents 1 Pattern format Glass chart 2 Images 3 See also 4 References 5 External links Pattern format The common MIL-STD-150A format consists of six "groups" in three layers of patterns. The largest groups, forming the first layer, are located on the outer sides. The smaller layers repeat the same pattern but are progressively smaller toward the center. Each group consists of six elements, numbered from 1 to 6. Within the same layer, the odd-numbered groups appear contiguously from 1 through 6 from the upper right corner. The first element of the even-numbered groups is at the lower right of the layer, with the remaining 2 through 6, at the left. The scales and dimensions of the bars are given by the expression although usually the following lookup table will be used. The line pair (lp) means a black and a white line. Number of Line Pairs / mm in USAF Resolving Power Test Target 1951 Group Number Element -2 -1 0 1 2 3 4 5 6 7 8 9 1 0.250 0.500 1.00 2.00 4.00 8.00 16.00 32.0 64.0 128.0 256.0 512.0 2 0.281 0.561 1.12 2.24 4.49 8.98 17.96 35.9 71.8 143.7 287.4 574.7 3 0.315 0.630 1.26 2.52 5.04 10.08 20.16 40.3 80.6 161.3 322.5 645.1 4 0.354 0.707 1.41 2.83 5.66 11.31 22.63 45.3 90.5 181.0 362.0 724.1 5 0.397 0.794 1.59 3.17 6.35 12.70 25.40 50.8 101.6 203.2 406.4 812.7 6 0.445 0.891 1.78 3.56 7.13 14.25 28.51 57.0 114.0 228.1 456.1 912.3 Width of 1 line in micrometers in USAF Resolving Power Test Target 1951 Group Number Element -2 -1 0 1 2 3 4 5 6 7 8 9 1 2000.00 1000.00 500.00 250.00 125.00 62.50 31.25 15.63 7.81 3.91 1.95 0.98 2 1781.80 890.90 445.45 222.72 111.36 55.68 27.84 13.92 6.96 3.48 1.74 0.87 3 1587.40 793.70 396.85 198.43 99.21 49.61 24.80 12.40 6.20 3.10 1.55 0.78 4 1414.21 707.11 353.55 176.78 88.39 44.19 22.10 11.05 5.52 2.76 1.38 0.69 5 1259.92 629.96 314.98 157.49 78.75 39.37 19.69 9.84 4.92 2.46 1.23 0.62 6 1122.46 561.23 280.62 140.31 70.15 35.08 17.54 8.77 4.38 2.19 1.10 0.55 Images USAF-1951 map, vector format SilverFast USAF 1951 Resolution Target by LaserSoft Imaging See also USAF 1951 target section, in Optical resolution References 1. MIL-STD-150A, its Change Notices and the Cancellation Notice are available from http://assist.daps.dla.mil External links efg's Tech Note: USAF 1951 and Microcopy Resolution Test Charts. (http://www.efg2.com/Lab/Imag eProcessing/TestTargets/#USAF1951) A USAF 1951 resolution chart (http://www.takinami.com/yoshihiko/photo/lens_test/USAF.pdf) in PDF format is provided by Yoshihiko Takinami (http://www.takinami.com/yoshihiko/photo/lens_test/ pdml-procedure.html). This chart should be printed such that the side of the square of the 1st element of the group -2 should be 10 mm long. USAF 1951 Resolution Target (http://www.silverfast.com/show/resolution-target/en.html) Further explanations and examples Koren 2003 (http://www.normankoren.com/Tutorials/MTF5.html): Norman Koren's updated resolution chart better suited for computer analysis Retrieved from "https://en.wikipedia.org/w/index.php? title=1951_USAF_resolution_test_chart&oldid=741572418" Categories: Imaging 1951 introductions History of the United States Air Force This page was last modified on 28 September 2016, at 09:54. Text is available under the Creative Commons Attribution-ShareAlike License; additional terms may apply. By using this site, you agree to the Terms of Use and Privacy Policy. Wikipedia® is a registered trademark of the Wikimedia Foundation, Inc., a non-profit organization.

