Data Analytics Engineering Quiz: Exploratory Data Analysis
advertisement

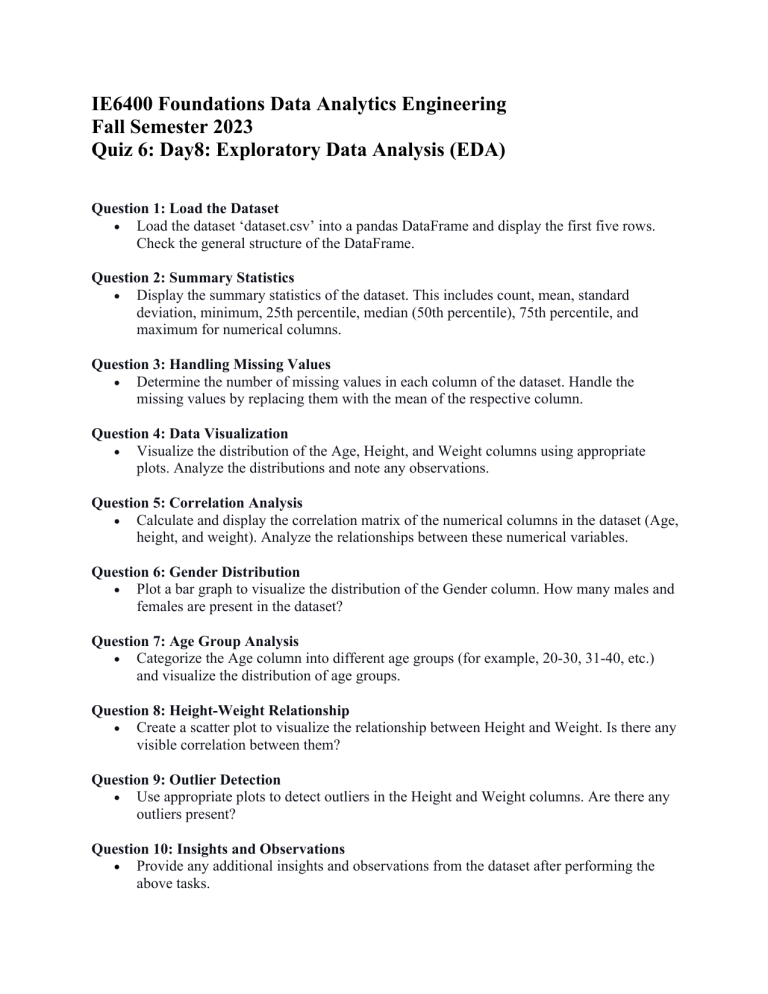
IE6400 Foundations Data Analytics Engineering Fall Semester 2023 Quiz 6: Day8: Exploratory Data Analysis (EDA) Question 1: Load the Dataset • Load the dataset ‘dataset.csv’ into a pandas DataFrame and display the first five rows. Check the general structure of the DataFrame. Question 2: Summary Statistics • Display the summary statistics of the dataset. This includes count, mean, standard deviation, minimum, 25th percentile, median (50th percentile), 75th percentile, and maximum for numerical columns. Question 3: Handling Missing Values • Determine the number of missing values in each column of the dataset. Handle the missing values by replacing them with the mean of the respective column. Question 4: Data Visualization • Visualize the distribution of the Age, Height, and Weight columns using appropriate plots. Analyze the distributions and note any observations. Question 5: Correlation Analysis • Calculate and display the correlation matrix of the numerical columns in the dataset (Age, height, and weight). Analyze the relationships between these numerical variables. Question 6: Gender Distribution • Plot a bar graph to visualize the distribution of the Gender column. How many males and females are present in the dataset? Question 7: Age Group Analysis • Categorize the Age column into different age groups (for example, 20-30, 31-40, etc.) and visualize the distribution of age groups. Question 8: Height-Weight Relationship • Create a scatter plot to visualize the relationship between Height and Weight. Is there any visible correlation between them? Question 9: Outlier Detection • Use appropriate plots to detect outliers in the Height and Weight columns. Are there any outliers present? Question 10: Insights and Observations • Provide any additional insights and observations from the dataset after performing the above tasks.


