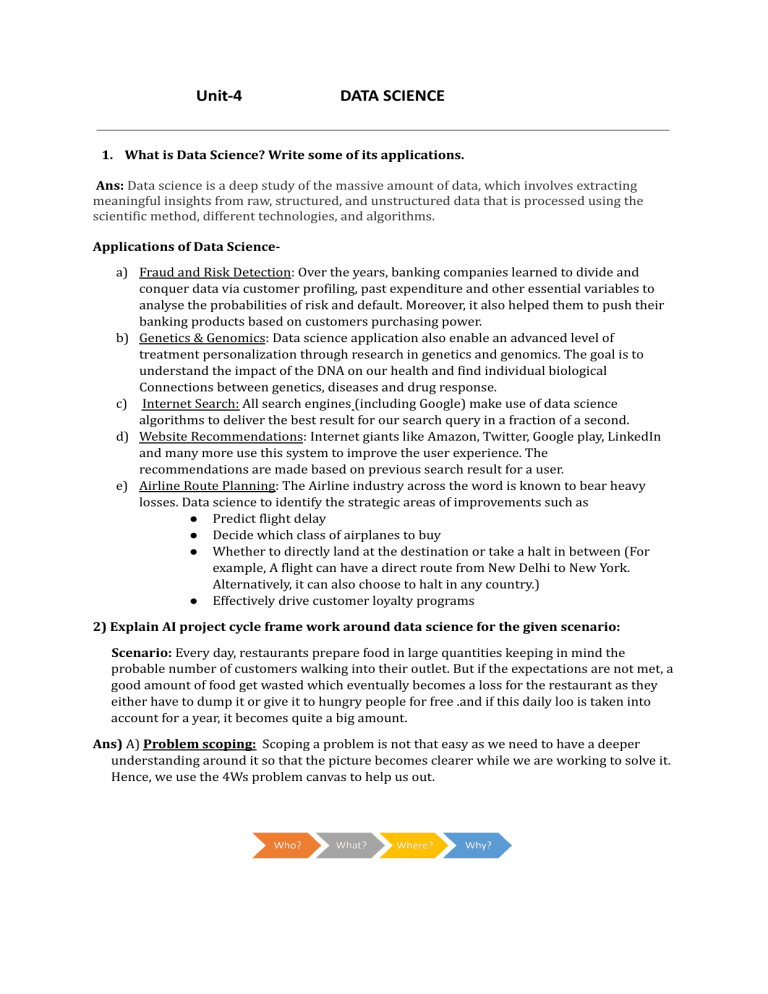
Unit-4 DATA SCIENCE 1. What is Data Science? Write some of its applications. Ans: Data science is a deep study of the massive amount of data, which involves extracting meaningful insights from raw, structured, and unstructured data that is processed using the scientific method, different technologies, and algorithms. Applications of Data Sciencea) Fraud and Risk Detection: Over the years, banking companies learned to divide and conquer data via customer profiling, past expenditure and other essential variables to analyse the probabilities of risk and default. Moreover, it also helped them to push their banking products based on customers purchasing power. b) Genetics & Genomics: Data science application also enable an advanced level of treatment personalization through research in genetics and genomics. The goal is to understand the impact of the DNA on our health and find individual biological Connections between genetics, diseases and drug response. c) Internet Search: All search engines (including Google) make use of data science algorithms to deliver the best result for our search query in a fraction of a second. d) Website Recommendations: Internet giants like Amazon, Twitter, Google play, LinkedIn and many more use this system to improve the user experience. The recommendations are made based on previous search result for a user. e) Airline Route Planning: The Airline industry across the word is known to bear heavy losses. Data science to identify the strategic areas of improvements such as ● Predict flight delay ● Decide which class of airplanes to buy ● Whether to directly land at the destination or take a halt in between (For example, A flight can have a direct route from New Delhi to New York. Alternatively, it can also choose to halt in any country.) ● Effectively drive customer loyalty programs 2) Explain AI project cycle frame work around data science for the given scenario: Scenario: Every day, restaurants prepare food in large quantities keeping in mind the probable number of customers walking into their outlet. But if the expectations are not met, a good amount of food get wasted which eventually becomes a loss for the restaurant as they either have to dump it or give it to hungry people for free .and if this daily loo is taken into account for a year, it becomes quite a big amount. Ans) A) Problem scoping: Scoping a problem is not that easy as we need to have a deeper understanding around it so that the picture becomes clearer while we are working to solve it. Hence, we use the 4Ws problem canvas to help us out. Problem statement Template: The Problem Statement Template helps us to summarise all the key points into one single Template so that in future, whenever there is need to look back at the basis of the problem, we can take a look at the Problem Statement Template and understand the key elements of scenario. B) Data Acquisition: In our scenario, various factors that would affect the quantity of food to be prepared for the next day consumption in buffets would be: For this problem, a dataset covering all the elements mentioned above is made for each dish prepared by the restaurant over a period of 30 days. C) Data Exploration: After creating the database, we now need to look at the data collected and understand what is required out it. In this case, since the goal of our scenario is to be predict the quantity of food to be prepared for next day, we need to have the following data. D) Modelling: Once the dataset is ready , we train our model on it .In this case a regression model is chosen in which the dataset is fed as a data frame and is trained accordingly. Regression is a supervised learning model which takes in continuous values of data over a period of time. E) Evaluation : Once the model has been trained on the training dataset of 20 days ,it is now time to see if the model is working properly or not. Once the model is able to achieve optimum efficiency , it is ready to be deployed in the restaurant for real- time usage. 3) Explain different types of sources of data. Ans) The various sources of data from where we can collect any type of data collection process can be categorised in two ways: a) Offline data collection: Sensors ,surveys, interviews , Observations. b) Online data collection : Open -sourced Government Portals, Retail Websites(kaggle), World Organisations open sourced statistical websites. 4) What points should be kept in mind while accessing data from any of the data sources. Ans) 1. Data which is available for public usage only should be taken up. 2. Personal datasets should only be used with the consent of the owner. 3. One should never breach someone’s privacy to collect data. 4. Data should only be taken form reliable sources as the data collected from random sources can be wrong or unusable. 5. Reliable sources of data ensure the authenticity of data which helps in proper training of the AI model 5) Explain different formats of data . Ans) For data science , usually the data is collected in the form of tables.The tabular datasets can be stored in different formats as below-. 1. CSV: CSV stands for comma separated values. It is a simple file format used to store tabular data. Each line of this file is a data record and each record consists of one or more fields which are separated by commas. Since the values of records are separated by a comma, hence they are known as CSV files. 2. Spreadsheet: A Spreadsheet is a piece of paper or a computer program which is used for accounting and recording data using rows and columns into which information can be entered. Microsoft Excel is a program which helps in creating spreadsheets. 3. SQL: SQL is a programming language also known as Structured Query Language. It is a domain specific language used in programming and is designed for managing data held in different kinds of DBMS (Database Management System) It is particularly useful in handling structured data. 6) Explain different various Python packages which help us in accessing structured data inside the code. Ans) a) Numpy: NumPy, which stands for Numerical Python, is the fundamental package for Mathematical and logical operations on arrays in Python. It is a commonly used package when it comes to working around numbers. NumPy gives a wide range of arithmetic operations around numbers giving us an easier approach in working with them. NumPy also works with arrays, which is nothing but a homogenous collection of Data. b) Pandas: Pandas is a software library written for the Python programming language for data manipulation and analysis. In particular, it offers data structures and operations for manipulating numerical tables and time series. The name is derived from the term "panel data", an econometrics term for data sets that include observations over multiple time periods for the same individuals. c) Matplotlib: Matplotlib is an amazing visualization library in Python for 2D plots of arrays. Matplotlib is a multiplatform data visualization library built on NumPy arrays. One of the greatest benefits of visualization is that it allows us visual access to huge amounts of data in easily digestible visuals. Matplotlib comes with a wide variety of plots. Plots help to understand trends, patterns, and to make correlations. They’re typically instruments for reasoning about quantitative information. 7) Differentiate between NumPy Arrays and Lists Ans) Numpy Arrays 1. Homogenous collection of data Lists 1.Heterogenous collection of data 2. It contains only one type of data, hence not flexible with datatypes 2.It contains multiple types of data, hence flexible with data types 3. Cannot be directly initializes. Can be operated with Numpy package only 3. Can be directly initialized as it is a part of python syntax. 4. Direct numerical operations can be done. For example, dividing the whole array by 3 divides every element by 3. 4. Direct numerical operations are not possible. For example, dividing the whole list by 3 cannot divide every element by 3. 5. Widely used for Arithmetic operation 5.Widely used for data management 6. Arrays take less memory space 6.Lists acquire more memory space. 7. Functions like concatenation, appending, reshaping, etc are not trivially possible with arrays 7.Functions like concatenation, appending, reshaping, etc are trivially possible with lists 8. Example: To create a numpy array ‘A’: import numpy A=numpy.array([1,2,3,4,5,6,7,8,9,0]) Example: To create a list: A = [1,2,3,4,5,6,7,8,9,0] 8.What are the different Statistical tools widely used in Python? Ans) Mean, Median,Mode , Standard deviation and Variance. 9. What are different types of issues related to data in data Visualisation? Ans) A) Erroneous Data: There are two ways in which the data can be erroneous: i) Incorrect values: The values in the dataset (at random places) are incorrect. For example, in the column of phone number, there is a decimal value or in the mark’s column, there is a name mentioned, etc. These are incorrect values that do not resemble the kind of data expected in that position. ii) Invalid or Null values: At some places, the values get corrupted and hence they become invalid. Many times, you will find NaN values in the dataset. B) Missing Data: In some datasets, some cells remain empty. The values of these cells are missing and hence the cells remain empty. Missing data cannot be interpreted as an error as the values here are not erroneous or might not be missing because of any error. C) Outliers: Data which does not fall in the range of a certain element are referred to as outliers. To understand this better, let us take an example of the marks of students in a class. Let us assume that a student was absent for exams and hence has got 0 marks in it. If his marks are taken into account, the whole class’s average would go down. To prevent this, the average is taken for the range of marks from highest to the lowest keeping this particular result separate. This makes sure that the average marks of the class are true according to the data. 10. What are various ways that data can be plotted as graphs in data Visualisation? Ans) In python , Matplotlib package helps in visualising the data and making some sense out of it. A) Scatter Plots: Scatter plot are used to plot discontinuous data; the data which does not have any continuity in flow is termed as discontinuous. There exist gaps in data that introduce discontinuity. In scatter plot, 2 axes x and y are two parameters and the colour of circles and the size both represent 2 different parameters. B) Bar Chart:It is one of the most commonly used graphical methods. It is a very easy-to-draw yet informative graphical representation . This is an example of double bar chart where the 2 axes depict 2 different parameters while bars of different colours work with different entities like women ,men etc Bar chart works with discontinuous data made at uniform intervals C) Histograms: Histograms are the accurate representation of continuous data. When it comes to plotting the variation in just one entity of a period of time , histograms are used. It represents the frequency of the variable at different points of time with the help of bins. D) Box Plots: When the data is split according to its percentile throughout the range, box plots come in Haman. Box plots also known as box and whiskers plot conveniently display the distribution of data throughout the range with the help of 4 quartiles. The plot contains a box and 2 lines at its left and right are the whiskers
