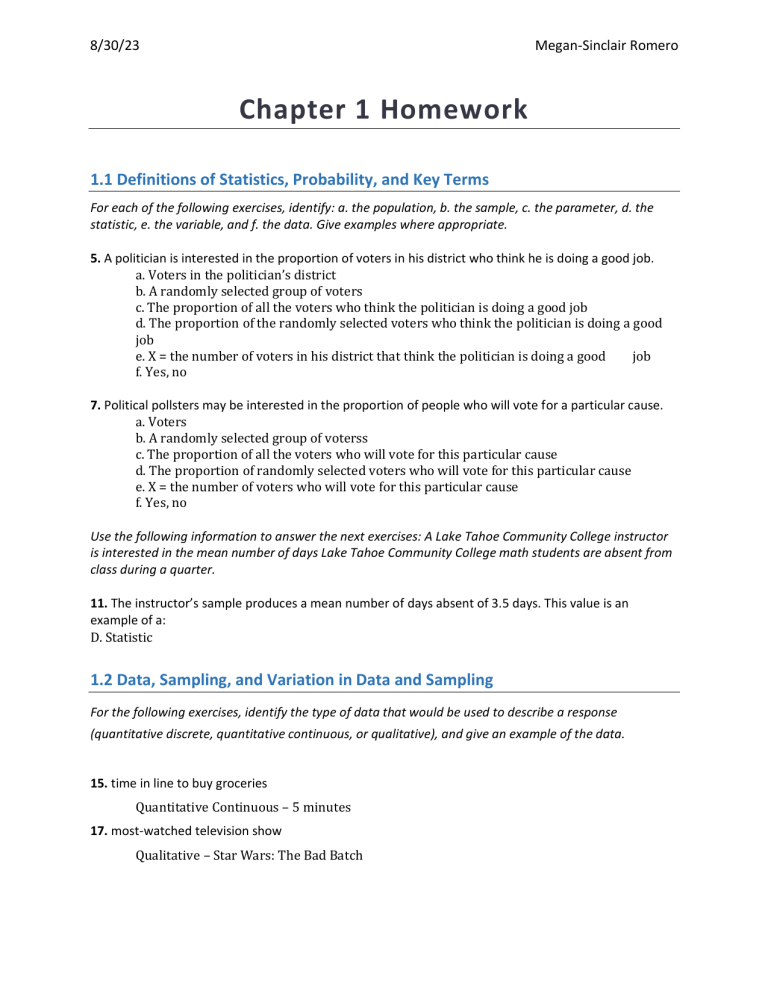
8/30/23 Megan-Sinclair Romero Chapter 1 Homework 1.1 Definitions of Statistics, Probability, and Key Terms For each of the following exercises, identify: a. the population, b. the sample, c. the parameter, d. the statistic, e. the variable, and f. the data. Give examples where appropriate. 5. A politician is interested in the proportion of voters in his district who think he is doing a good job. a. Voters in the politician’s district b. A randomly selected group of voters c. The proportion of all the voters who think the politician is doing a good job d. The proportion of the randomly selected voters who think the politician is doing a good job e. X = the number of voters in his district that think the politician is doing a good job f. Yes, no 7. Political pollsters may be interested in the proportion of people who will vote for a particular cause. a. Voters b. A randomly selected group of voterss c. The proportion of all the voters who will vote for this particular cause d. The proportion of randomly selected voters who will vote for this particular cause e. X = the number of voters who will vote for this particular cause f. Yes, no Use the following information to answer the next exercises: A Lake Tahoe Community College instructor is interested in the mean number of days Lake Tahoe Community College math students are absent from class during a quarter. 11. The instructor’s sample produces a mean number of days absent of 3.5 days. This value is an example of a: D. Statistic 1.2 Data, Sampling, and Variation in Data and Sampling For the following exercises, identify the type of data that would be used to describe a response (quantitative discrete, quantitative continuous, or qualitative), and give an example of the data. 15. time in line to buy groceries Quantitative Continuous – 5 minutes 17. most-watched television show Qualitative – Star Wars: The Bad Batch 8/30/23 Megan-Sinclair Romero Use the following information to answer the next exercise: A study was done to determine the age, number of times per week, and the duration (amount of time) of resident use of a local park in San Jose. The first house in the neighborhood around the park was selected randomly and then every 8th house in the neighborhood around the park was interviewed. 23. “Duration (amount of time)” is what type of data? C. Quantitative Continuous 25. Suppose you want to determine the mean number of students per statistics class in your state. Describe a possible sampling method in three to five complete sentences. Make the description detailed. I would use stratified sampling to account for varying characteristics among classes. Firstly, I would stratify each class in the state based on either total school population or specialized classes. After that, I would randomly select a number of classes from each stratum proportional to their grouping factor. Once that is done, I’d simply calculate the mean by adding up the number of students and dividing that by the number of classes selected. I would either school population as a whole or specialized classes specifically as a factor to stratify because class population can vary wildly based on those factors. 27. List some practical difficulties involved in getting accurate results from a telephone survey. If the survey is purposefully or accidentally done with replacement, it could cause repeat responses. Other complications include people not picking up the phone, people lying on the survey, & phone numbers or lines being disconnected. 33. A “random survey” was conducted of 3,274 people of the “microprocessor generation” (people born since 1971, the year the microprocessor was invented). It was reported that 48% of those individuals surveyed stated that if they had $2,000 to spend, they would use it for computer equipment. Also, 66% of those surveyed considered themselves relatively savvy computer users. Additional information: The survey, reported by Intel Corporation, was filled out by individuals who visited the Los Angeles Convention Center to see the Smithsonian Institute's road show called “America’s Smithsonian.” a. Do you consider the sample size large enough for a study of this type? Why or why not? Considering the world population rose by roughly 4.5 billion since 1971, I’d say the sample size was quite small. I wouldn’t consider the sample to be large enough for this study, especially considering this random sample was performed in only one place for a presumably short period of time. b. Based on your “gut feeling,” do you believe the percents accurately reflect the U.S. population for those individuals born since 1971? If not, do you think the percents of the population are actually higher or lower than the sample statistics? Why? My best educated guess would say the majority of people would spend an extra $2,000 on bills, mostly because it seems that there is a large population in the US struggling to make ends meet or have food to serve to their families. The minimum wage is still $7.25, meanwhile housing is becoming more and more expensive. So no, I don’t believe the percentages given accurately represent the population. I believe they’d be much lower. 8/30/23 Megan-Sinclair Romero c. With the additional information, do you feel that all demographic and ethnic groups were equally represented at the event? Why or why not? Likely not, given this took place in Los Angeles only for a specific event that took place in what I believe to be a single day. It’s definitely possible that people travelled across the country (or even the world) to attend this event, however that alone shows implicit bias. d. With the additional information, comment on how accurately you think the sample statistics reflect the population parameters. People who not only were interested in specifically the Smithsonian, but also had the means to travel there and attend the convention were almost certainly the main demographic of participants in the survey. Meaning the sample was in all likelihood, not at all representative of the US population as a whole. 35. In advance of the 1936 Presidential Election, a magazine titled Literary Digest released the results of an opinion poll predicting that the republican candidate Alf Landon would win by a large margin. The magazine sent post cards to approximately 10,000,000 prospective voters. These prospective voters were selected from the subscription list of the magazine, from automobile registration lists, from phone lists, and from club membership lists. Approximately 2,300,000 people returned the postcards. a. Think about the state of the United States in 1936. Explain why a sample chosen from magazine subscription lists, automobile registration lists, phone books, and club membership lists was not representative of the population of the United States at that time. In 1936, those that had access to all of the methods the magazine company utilized to collect data were likely well-off and/or were city folk who had means to spend their money on those (at the time) luxuries. So, obviously not representative of the US population as a whole. b. What effect does the low response rate have on the reliability of the sample? This introduces an even greater possibility of sampling bias, since those who responded likely would've had a large psychological incentive to do so. Concepts like “The Loud Minority” and “The Silent Majority” let us know that that those who want to speak will ultimately speak, which harms the reliability of the sample. c. Are these problems examples of sampling error or nonsampling error? This is clearly an issue of nonsampling error, since 7.7 million potential voters didn’t respond. The problems with this sample are not from a lack of trying. Especially since the methods of mass communication in 1936 were finite and they used a method that relied on their randomly selected participants to actually participate. d. During the same year, George Gallup conducted his own poll of 30,000 prospective voters. These researchers used a method they called "quota sampling" to obtain survey answers from specific subsets of the population. Quota sampling is an example of which sampling method described in this module? Convenience sampling 1.3 Levels of Measurement 39. Fifty part-time students were asked how many courses they were taking this term. The (incomplete) results are shown below: 8/30/23 Megan-Sinclair Romero # of courses Frequency Relative frequency 1 2 3 30 15 5 0.6 0.3 0.1 Cumulative relative frequency 0.6 0.9 1.0 a. Fill in the blanks in the table. b. What percent of students take exactly two courses? 30% c. What percent of students take one or two courses? 90% 41. Nineteen immigrants to the U.S were asked how many years, to the nearest year, they have lived in the U.S. The data are as follows: 2; 5; 7; 2; 2; 10; 20; 15; 0; 7; 0; 20; 5; 12; 15; 12; 4; 5; 10 . Data Frequency Relative frequency Cumulative relative frequency 0 2 2/19 0.1053 2 3 3/19 0.2632 4 1 1/19 0.3158 5 3 3/19 0.4737 7 2 2/19 0.5789 10 2 2/19 0.6842 12 2 2/19 0.7895 15 2 2/19 0.8421 20 2 2/19 1.0000 a. Fix the errors in the table. Also, explain how someone might have arrived at the incorrect number(s). The table would be filled out from left to right, this makes the errors in the Frequency and Relative Frequency understandable since, working with wrong data you get wrong results. It’s likely a miscount occurred when clocking the frequency of year’s 15 and 20. And for the error in Cumulative Relative Frequency, the extra 1 could be explained by a simple typo. b. Explain what is wrong with this statement: “47 percent of the people surveyed have lived in the U.S. for 5 years.” It is almost correct, but not precise given that “47%” is being used based on its relative frequency rather than its cumulative relative frequency. c. Fix the statement in b to make it correct. 47% of the people surveyed have lived in the U.S. for 5 years or less. d. What fraction of the people surveyed have lived in the U.S. five or seven years? 5/19 or 26.32% e. What fraction of the people surveyed have lived in the U.S. at most 12 years? 14/19 8/30/23 Megan-Sinclair Romero f. What fraction of the people surveyed have lived in the U.S. fewer than 12 years? 12/19 g. What fraction of the people surveyed have lived in the U.S. from five to 20 years, inclusive? 13/19 43. Forbes magazine published data on the best small firms in 2012. These were firms which had been publicly traded for at least a year, have a stock price of at least $5 per share, and have reported annual revenue between $5 million and $1 billion. The table shows the ages of the chief executive officers for the first 60 ranked firms. Age Frequency Relative frequency Cumulative relative frequency 0.0500 0.0500 40-44 3 0.1833 0.2333 45-49 11 0.2167 0.4500 50-54 13 0.2667 0.7167 55-59 16 0.1667 0.8833 60-64 10 0.1000 0.9833 65-69 6 0.0167 1.0000 70-74 1 a. What is the frequency for CEO ages between 54 and 65? 26 b. What percentage of CEOs are 65 years or older? 11.67% c. What is the relative frequency of ages under 50? 23.33% (0.2333) d. What is the cumulative relative frequency for CEOs younger than 55? 45% (0.45) e. Which graph shows the relative frequency and which shows the cumulative relative frequency? Graph A represents relative frequency. Graph B represents cumulative relative frequency. 8/30/23 Megan-Sinclair Romero Use the following information to answer the next two exercises: The table contains data on hurricanes that have made direct hits on the U.S. Between 1851 and 2004. A hurricane is given a strength category rating based on the minimum wind speed generated by the storm. Category 1 2 3 4 5 Number of direct hits 109 72 71 18 3 Total = 273 Relative frequency 0.3993 0.2637 0.2601 0.0659 0.0110 Cumulative frequency 0.3993 0.6630 0.9231 0.9890 1.0000 45. What is the relative frequency of direct hits that were AT MOST a category 3 storm? 0.9231
