Uploaded by
Boopbeep Doobap
Data Analytics Exam Review: Hypothesis Testing & Regression
advertisement

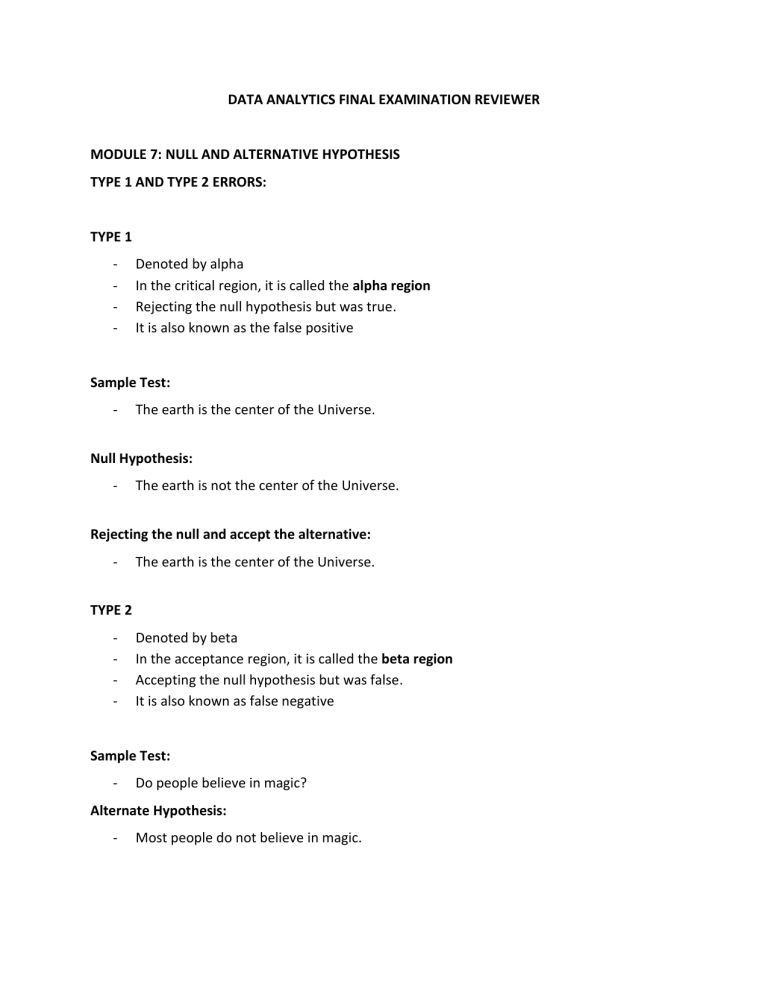
DATA ANALYTICS FINAL EXAMINATION REVIEWER MODULE 7: NULL AND ALTERNATIVE HYPOTHESIS TYPE 1 AND TYPE 2 ERRORS: TYPE 1 - Denoted by alpha In the critical region, it is called the alpha region Rejecting the null hypothesis but was true. It is also known as the false positive Sample Test: - The earth is the center of the Universe. Null Hypothesis: - The earth is not the center of the Universe. Rejecting the null and accept the alternative: - The earth is the center of the Universe. TYPE 2 - Denoted by beta In the acceptance region, it is called the beta region Accepting the null hypothesis but was false. It is also known as false negative Sample Test: - Do people believe in magic? Alternate Hypothesis: - Most people do not believe in magic. Failed to prove the alternate hypothesis: - Most people believe in magic and failed to prove the alternate hypothesis. Level of Significance - It is denoted by alpha or α It is the degree of significance of accepting or rejecting the H0. It specifies the allowable probability of making a type 1 error. It is determined before the study to know the strength of evidence in the sample before rejecting the null hypothesis. Allowable values are α = 0.05 and α = 0.01 MODULE 8 – T-TEST T-TEST - It allows you to know the differences between two groups and it is measured through means or average. In every T-Test, it results into t-value. The t-value is a type of test statistic that evaluates the data sample. The larger the t-value, the larger difference in two groups. ANOVA (Analysis of Variance) - Compares the mean of two or more groups which are significantly different from each other. SUMMARY Table: Groups: Names of the groups Count: Number of observation in each group Sum: Sum of the values in each group Average: Average value in each group Variance: Variance of the values in each group ANOVA Table: Source of Variation: Variation being measured either between or within groups SS: The sum of squares for each source of variation. Sum of squares.PNG df: The degrees of freedom, calculated as Between (df) = No. of groups-1 Within (df) = No. observations – No. groups MS: The mean sum of squares, computed as SS / df F: F-value, computed as MS Between / MS Within P-value: P-value corresponding to the F-value F crit: F critical value corresponding to α = .05 - If the P-value < α, we reject the null hypothesis. Moreover, if the F-value > F crit, we reject the null hypothesis. MODULE 9 – CHI-SQUARE Chi Square test for independence - It compares two categorical variables in a table to see if they are related or whether the distribution of these variables differ from each other. Chi Square Statistic - It is used to evaluate test of independence in a bivariate table (displays the distribution of one variable across the categories of another variable). Formula: MODULE 10: LOGISTIC REGRESSION Logistic Regression - It is a predictive analysis used to describe the data and the relationship between the dependent and independent variable. it is used when the dependent variable (target) is categorical. it analyzes variables which are CONTINUOUS (NUMERICAL) it is a statistical way of measuring relationship between variables. (Dependent or independent) it is used to predict future/probability of an event occurring one of the simplest algorithms when it comes to Machine Learning. o Machine Learning is a type of artificial intelligence (AI) that allows software applications to become more accurate at predicting outcomes without being explicitly programmed to do so. Discrete (categorical) - countable nothing in between digital for example, gender, marital status, exam result (pass, fail) - Continuous (quantitative) infinite/uncountable always something in between analog for example, wind speed, temperature, volts of electricity


