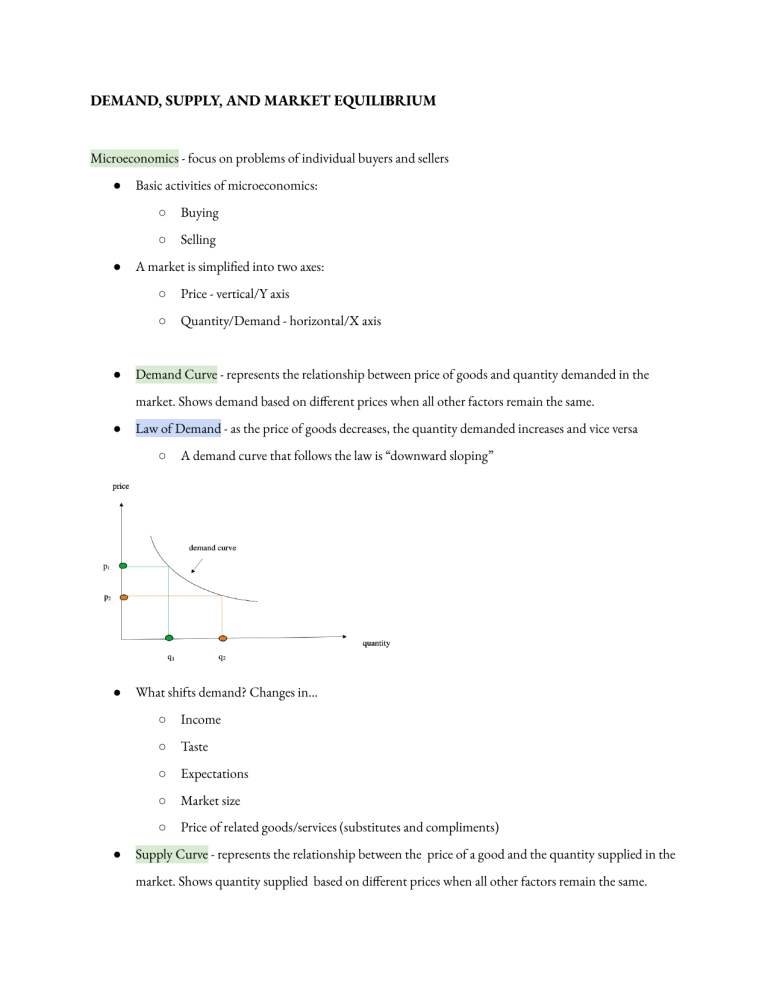
DEMAND, SUPPLY, AND MARKET EQUILIBRIUM Microeconomics - focus on problems of individual buyers and sellers ● ● ● Basic activities of microeconomics: ○ Buying ○ Selling A market is simplified into two axes: ○ Price - vertical/Y axis ○ Quantity/Demand - horizontal/X axis Demand Curve - represents the relationship between price of goods and quantity demanded in the market. Shows demand based on different prices when all other factors remain the same. ● Law of Demand - as the price of goods decreases, the quantity demanded increases and vice versa ○ ● ● A demand curve that follows the law is “downward sloping” What shifts demand? Changes in… ○ Income ○ Taste ○ Expectations ○ Market size ○ Price of related goods/services (substitutes and compliments) Supply Curve - represents the relationship between the price of a good and the quantity supplied in the market. Shows quantity supplied based on different prices when all other factors remain the same. ● Law of Supply - as price of goods decrease, it’s quality supplied also decreases and vice versa ○ ● ● A supply curve that follows this law is “upward sloping” What shifts supply? Changes in: ○ Technology ○ Input prices ○ Expectations ○ Number of producers/manufacturers ○ Price of related goods/services (substitutes and compliments) Equilibrium Price (PE) - price at which market clears ○ Quantity demanded = quantity supplied ○ Point where supply and demand curves meet ● Equilibrium Quantity (QE) ● What happens when a price is not at equilibrium: ○ Excess supply - quantity demanded < quantity supplied - at any price above equilibrium ○ Excess demand - quantity demanded > quantity supplied - at any price below equilibrium ● ● Linear Demand Curve - straight line ○ Following law of demand, appears “downward sloping straight” ○ q = A - Bp ■ q = quantity demanded ■ p = price ■ A,B = positive numbers Linear Supply Curve - straight line ○ Following law of supply, appears “upward sloping straight” ○ q = C + Dp ■ ● q = quantity supplied Determining PE with linear curves ○ Quantity demanded = quantity supplied ○ Demand curve is q = 80 -3p ○ Supply curve is q = 20 + p ○ At equilibrium we have 80 - 3p = 20 + p ■ 80 - 20 = 3p + p ■ 60 = 4p ■ 60/4 = p ■ 15 = p


