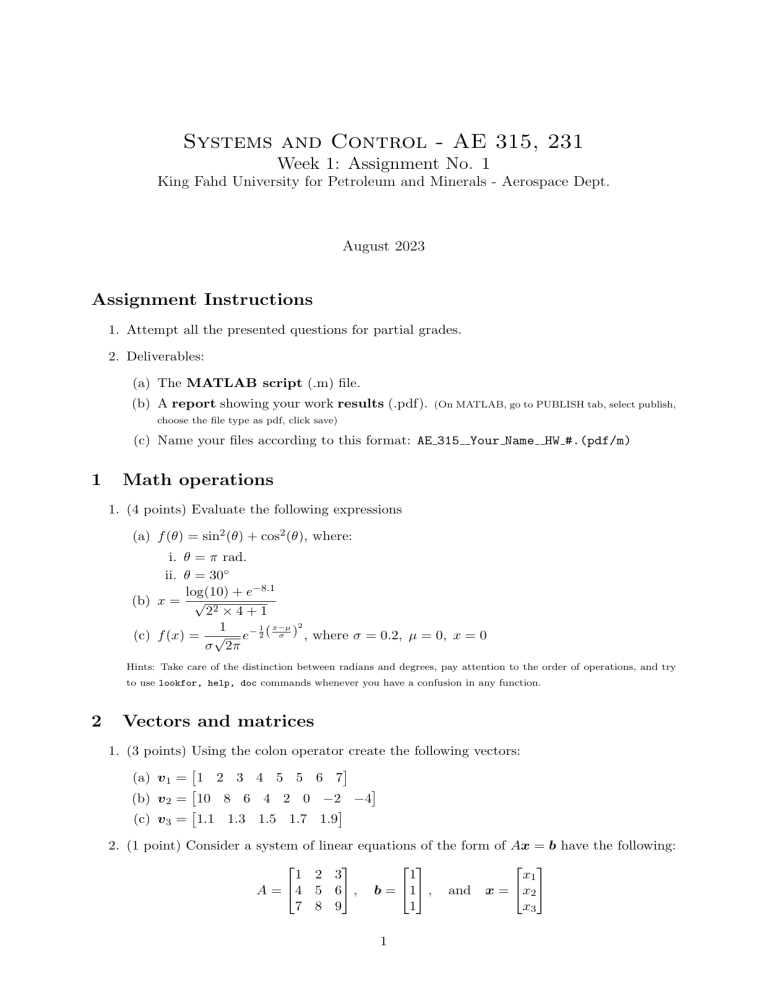
Systems and Control - AE 315, 231 Week 1: Assignment No. 1 King Fahd University for Petroleum and Minerals - Aerospace Dept. August 2023 Assignment Instructions 1. Attempt all the presented questions for partial grades. 2. Deliverables: (a) The MATLAB script (.m) file. (b) A report showing your work results (.pdf). (On MATLAB, go to PUBLISH tab, select publish, choose the file type as pdf, click save) (c) Name your files according to this format: AE 315 Your Name HW #.(pdf/m) 1 Math operations 1. (4 points) Evaluate the following expressions (a) f (θ) = sin2 (θ) + cos2 (θ), where: i. θ = π rad. ii. θ = 30◦ log(10) + e−8.1 (b) x = √ 22 × 4 + 1 1 x−µ 2 1 (c) f (x) = √ e− 2 ( σ ) , where σ = 0.2, µ = 0, x = 0 σ 2π Hints: Take care of the distinction between radians and degrees, pay attention to the order of operations, and try to use lookfor, help, doc commands whenever you have a confusion in any function. 2 Vectors and matrices 1. (3 points) Using the (a) v 1 = 1 2 3 (b) v 2 = 10 8 6 (c) v 3 = 1.1 1.3 colon operator create the following vectors: 4 5 5 6 7 4 2 0 −2 −4 1.5 1.7 1.9 2. (1 point) Consider a system of linear equations of the form of Ax = b have the following: 1 2 3 1 x1 A = 4 5 6 , b = 1 , and x = x2 7 8 9 1 x3 1 This system can be solved using the simple formula x = A−1 b write a MATLAB code to solve for the x vector. 3 Visualization 1. (2 points) Reconsider the formula given in Question 1, point (c) agian: 1 x−µ 2 1 f (x) = √ e− 2 ( σ ) σ 2π (1) The formula describes what so called the Normal (Gaussian) distribution. We want to investigate the effect of changing both µ (the mean) and σ (the standard deviation) on the shape of this function. So, (a) Create a vector x using linspace command starting with -5 and ending at 5 with a total number of points = 100. (b) Evaluate the following function in equation 1 with the following parameters: i. f 1 with µ = 0 and σ = 0.15 ii. f 2 with µ = 0 and σ = 1 iii. f 3 with µ = −2 and σ = 0.4 Hint: You should expect f1 , f2 , and f3 to be vectors of size (1, 100), check using whos command (c) Plot f 1 , f 2 , f 3 in the y-axis against the x vector on the x-axis (d) Write down a code to show the xlabel (x), ylabel (f (x)), legend, and the title (plot for the normal distribution) Hint: You should end up having a plot that looks like figure 1. Figure 1: Question 3 plot reference 2


