Measures of Central Tendency: Mean, Median, Mode, Quantiles
advertisement

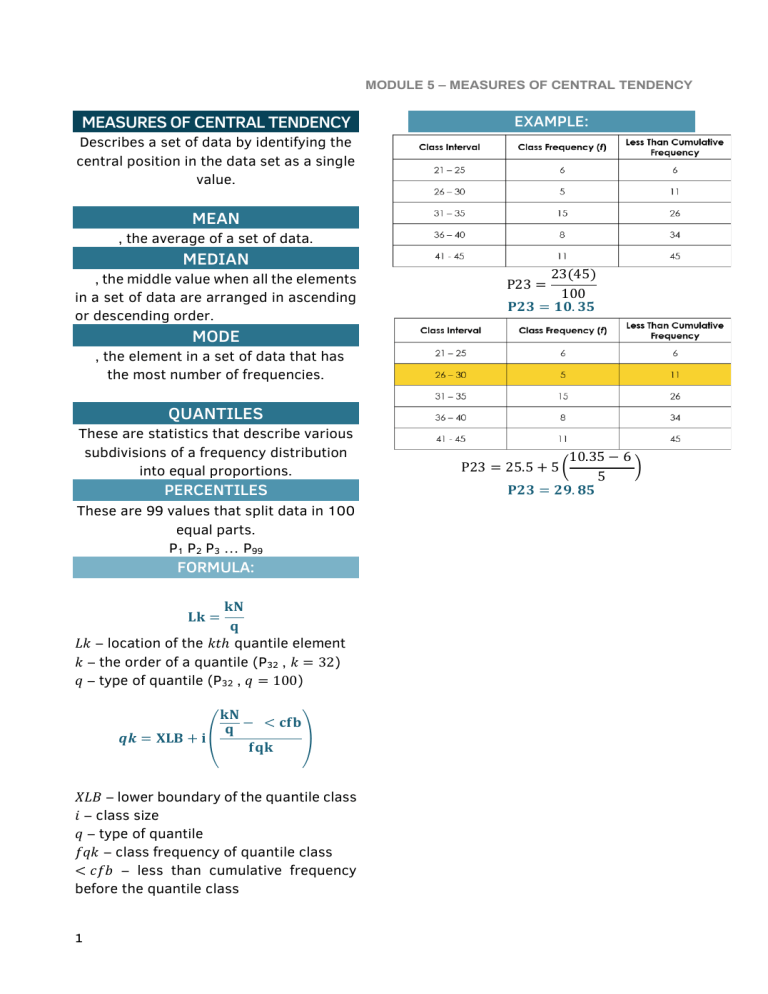
MODULE 5 – MEASURES OF CENTRAL TENDENCY MEASURES OF CENTRAL TENDENCY EXAMPLE: Describes a set of data by identifying the central position in the data set as a single value. MEAN , the average of a set of data. MEDIAN , the middle value when all the elements in a set of data are arranged in ascending or descending order. 23(45) 100 𝐏𝟐𝟑 = 𝟏𝟎. 𝟑𝟓 P23 = MODE , the element in a set of data that has the most number of frequencies. QUANTILES These are statistics that describe various subdivisions of a frequency distribution into equal proportions. PERCENTILES These are 99 values that split data in 100 equal parts. P1 P2 P3 … P99 FORMULA: 𝐤𝐍 𝐪 𝐿𝑘 – location of the 𝑘𝑡ℎ quantile element 𝑘 – the order of a quantile (P32 , 𝑘 = 32) 𝑞 – type of quantile (P32 , 𝑞 = 100) 𝐋𝐤 = 𝐤𝐍 − < 𝐜𝐟𝐛 𝐪 𝒒𝒌 = 𝐗𝐋𝐁 + 𝐢 ( ) 𝐟𝐪𝐤 𝑋𝐿𝐵 – lower boundary of the quantile class 𝑖 – class size 𝑞 – type of quantile 𝑓𝑞𝑘 – class frequency of quantile class < 𝑐𝑓𝑏 – less than cumulative frequency before the quantile class 1 10.35 − 6 P23 = 25.5 + 5 ( ) 5 𝐏𝟐𝟑 = 𝟐𝟗. 𝟖𝟓


